Cognizant Technology Solutions Corporation's management explains the business in its own materials. The slides below do the most of that work, pulled from the documents preserved in Sources. Each source link opens the complete presentation at that slide in a new tab.
Management's fullest statement of what Cognizant does, how it makes money and its 2027 plan — market sizing, segments, the AI strategy and financial targets. · Open the full document →
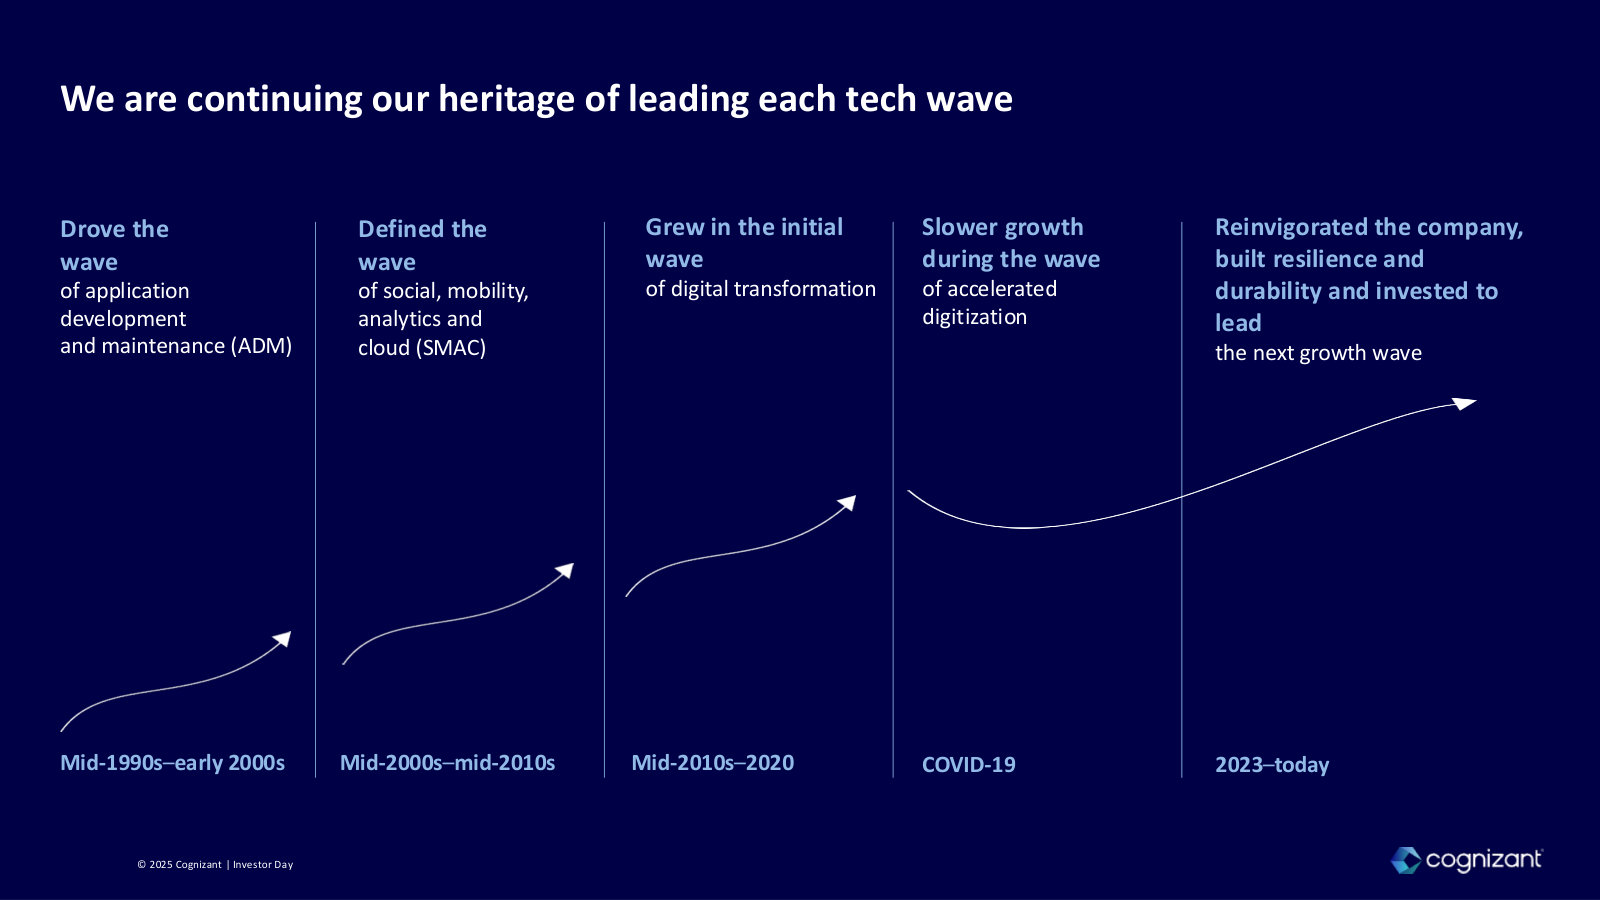
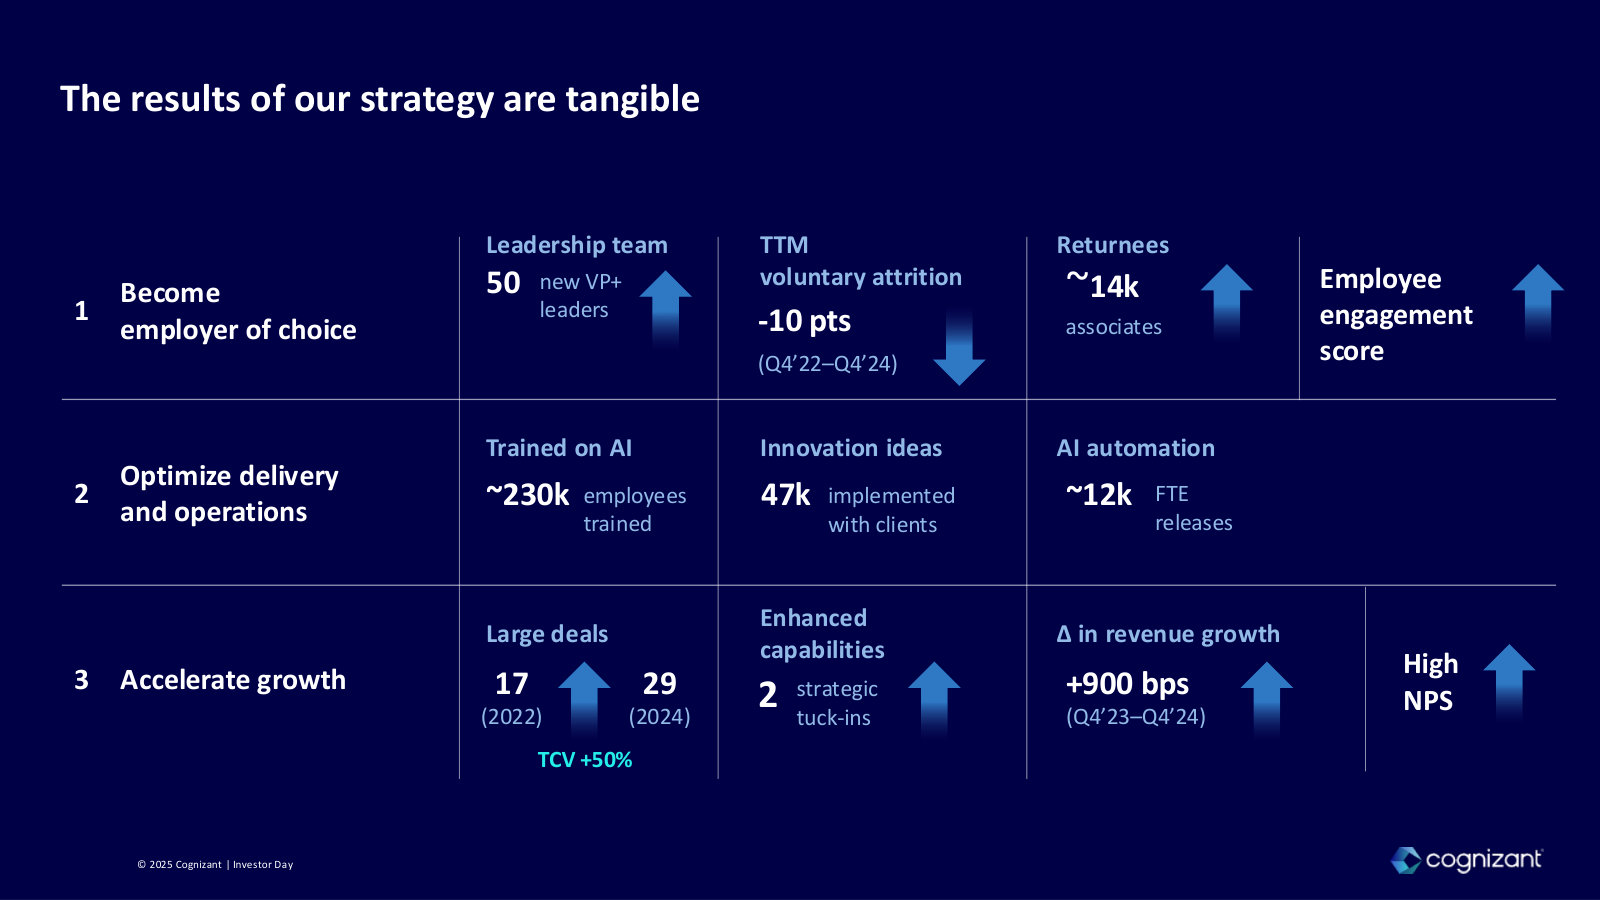
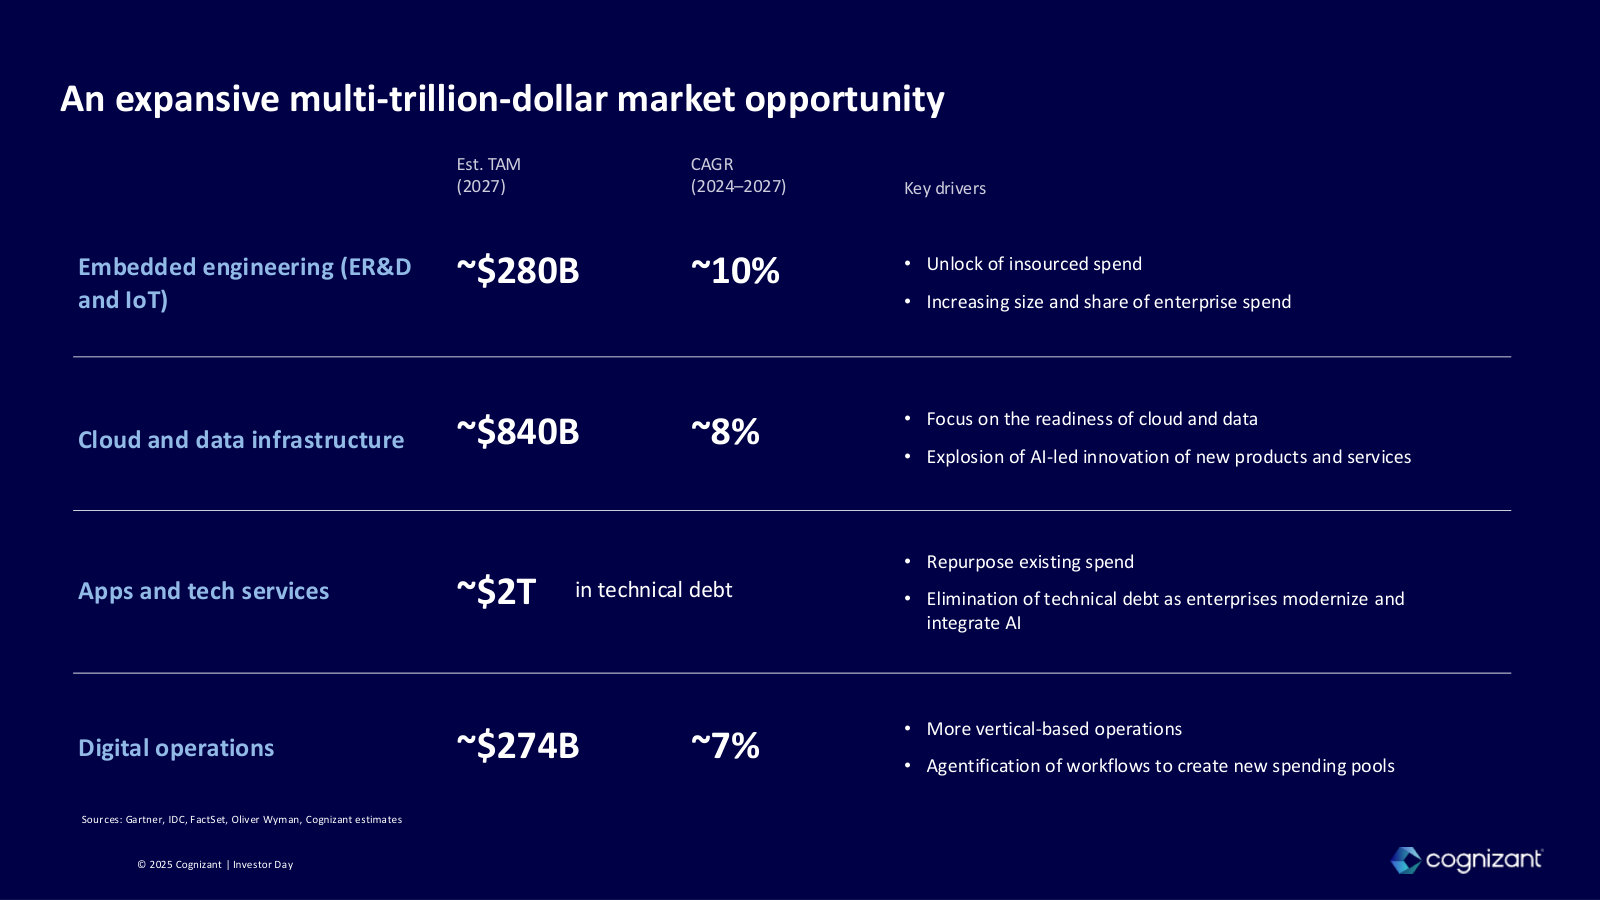
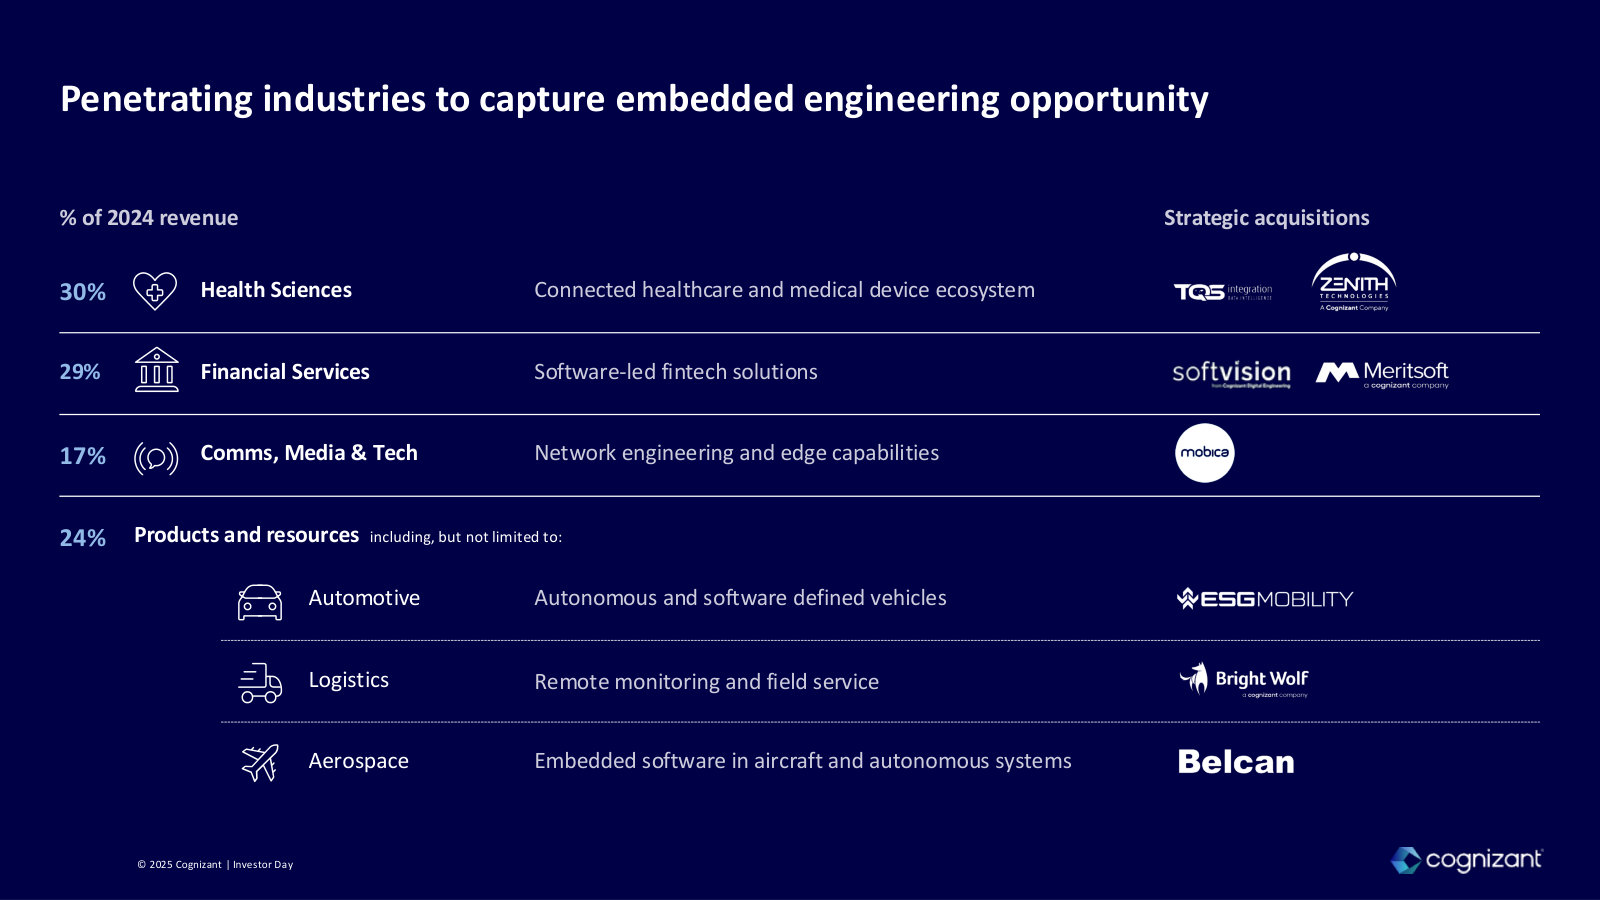
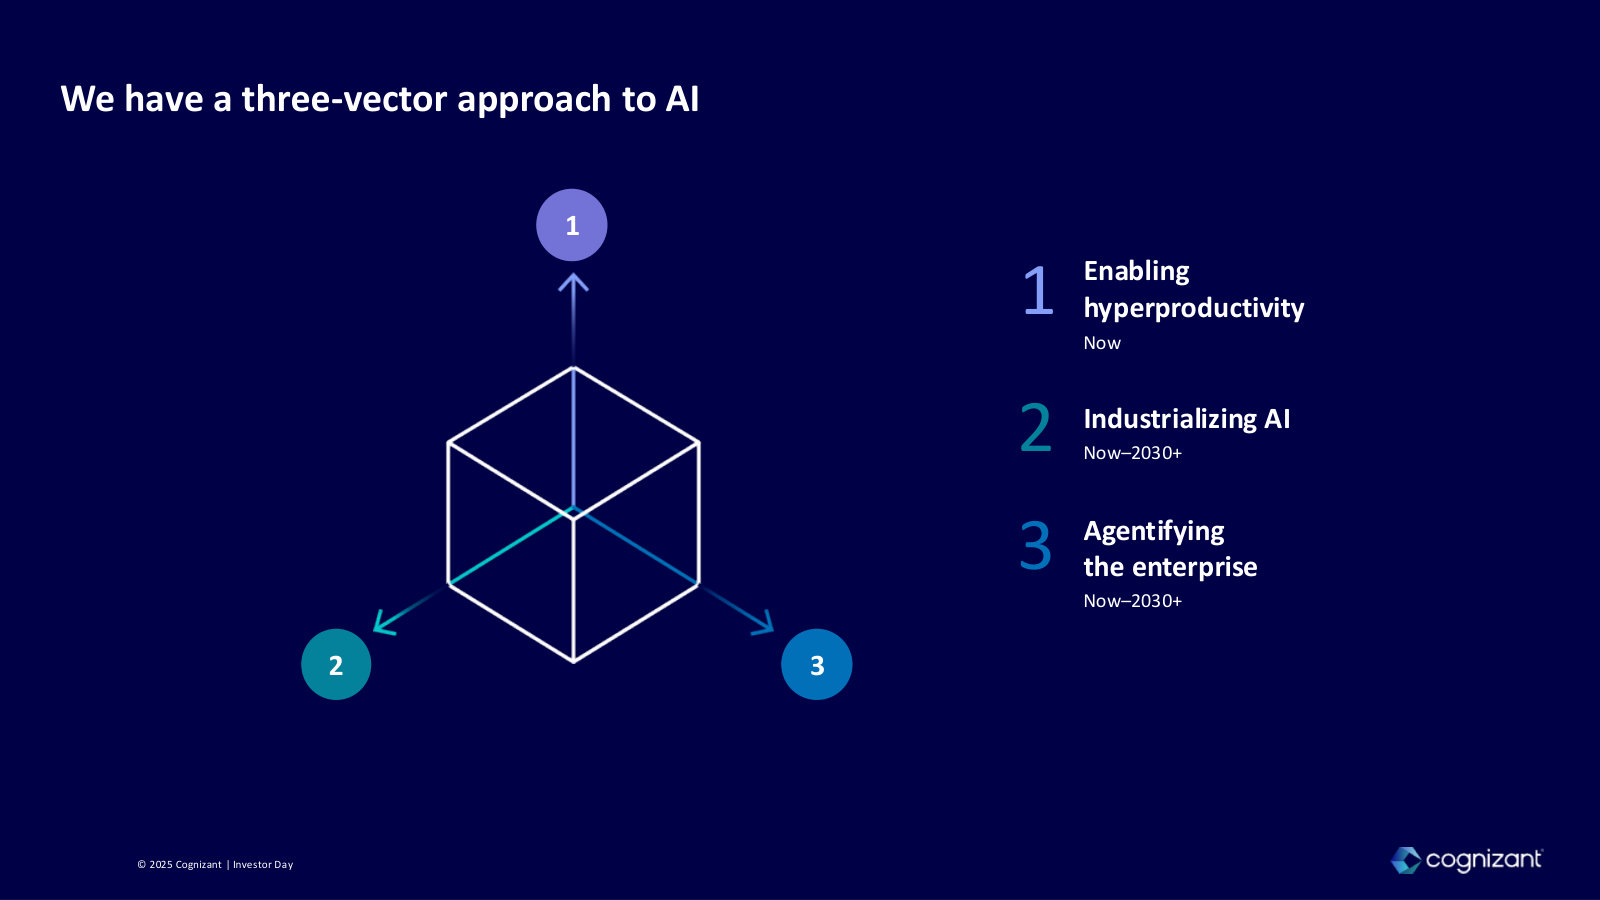
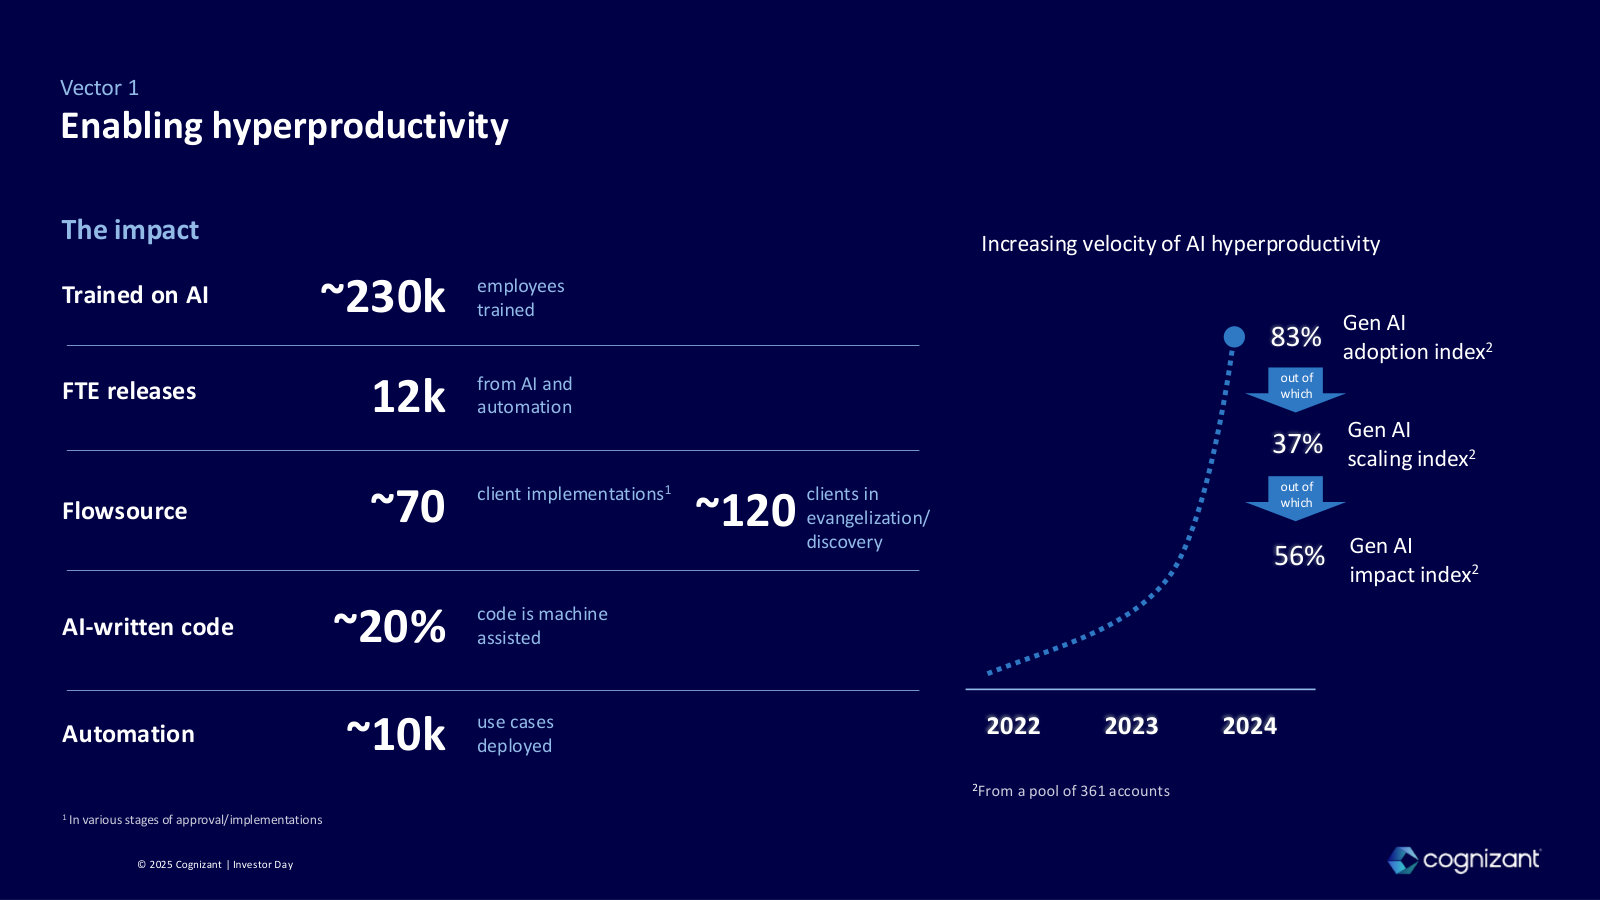
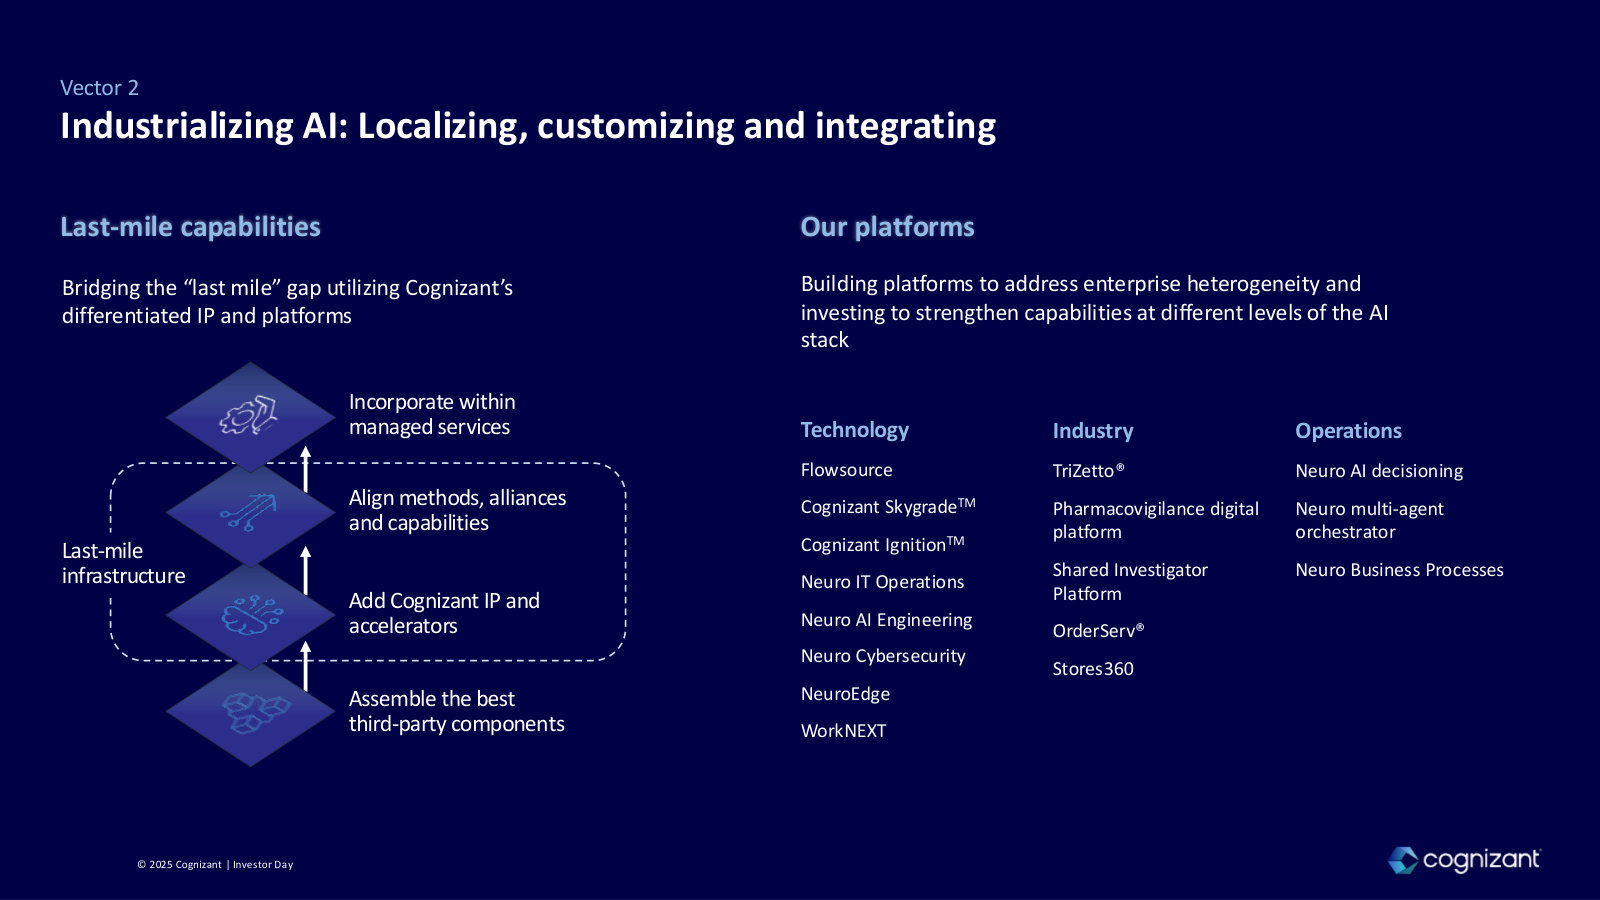
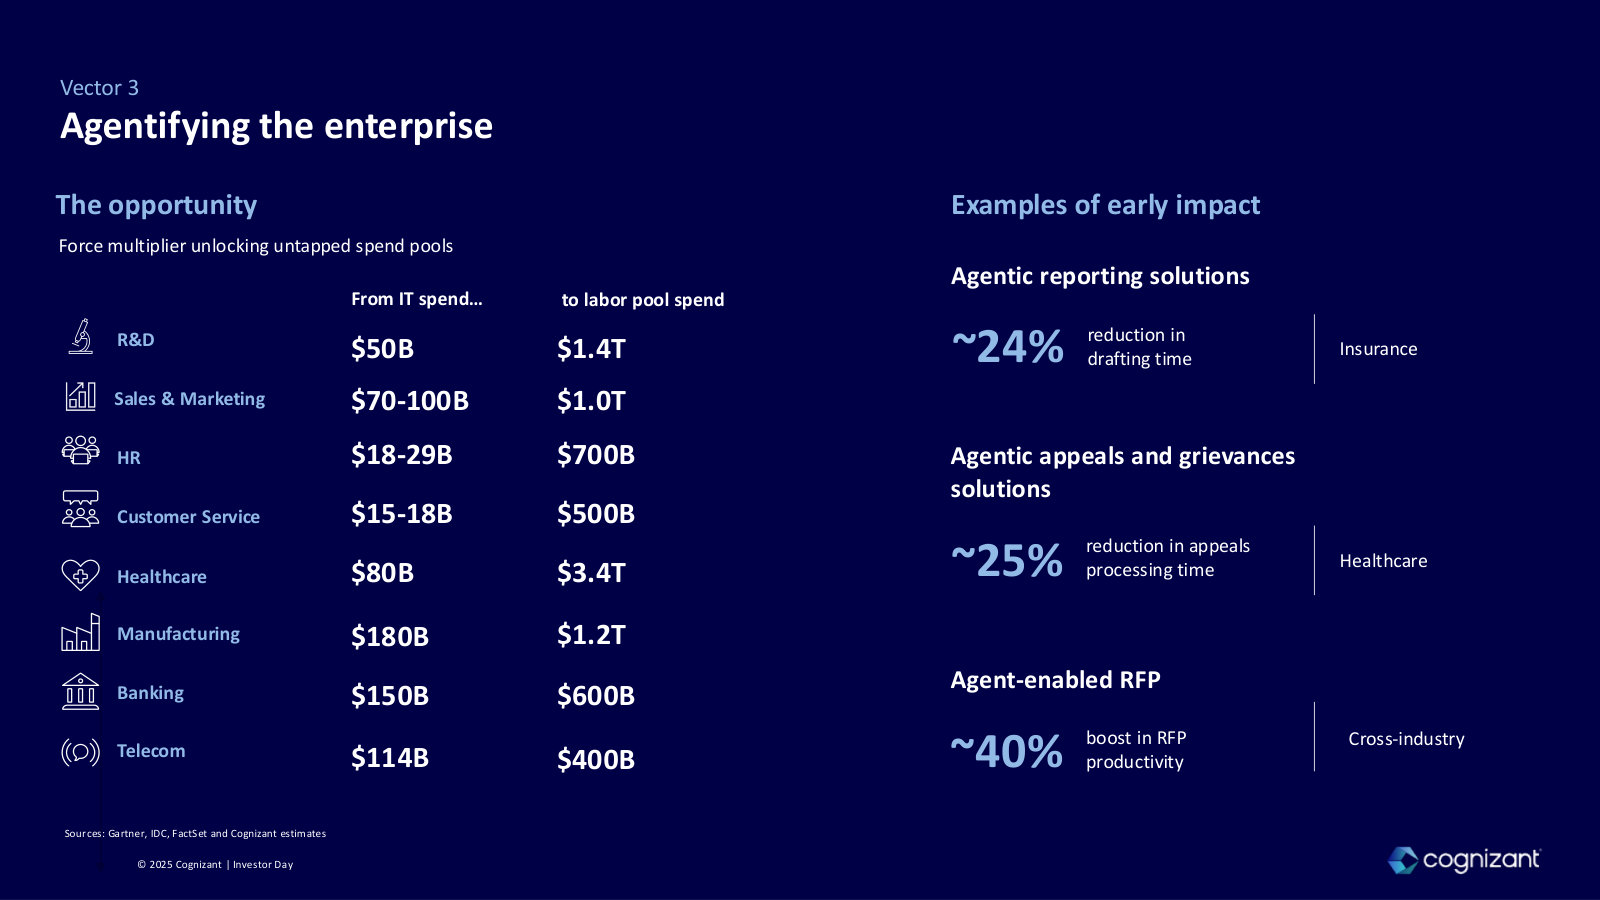
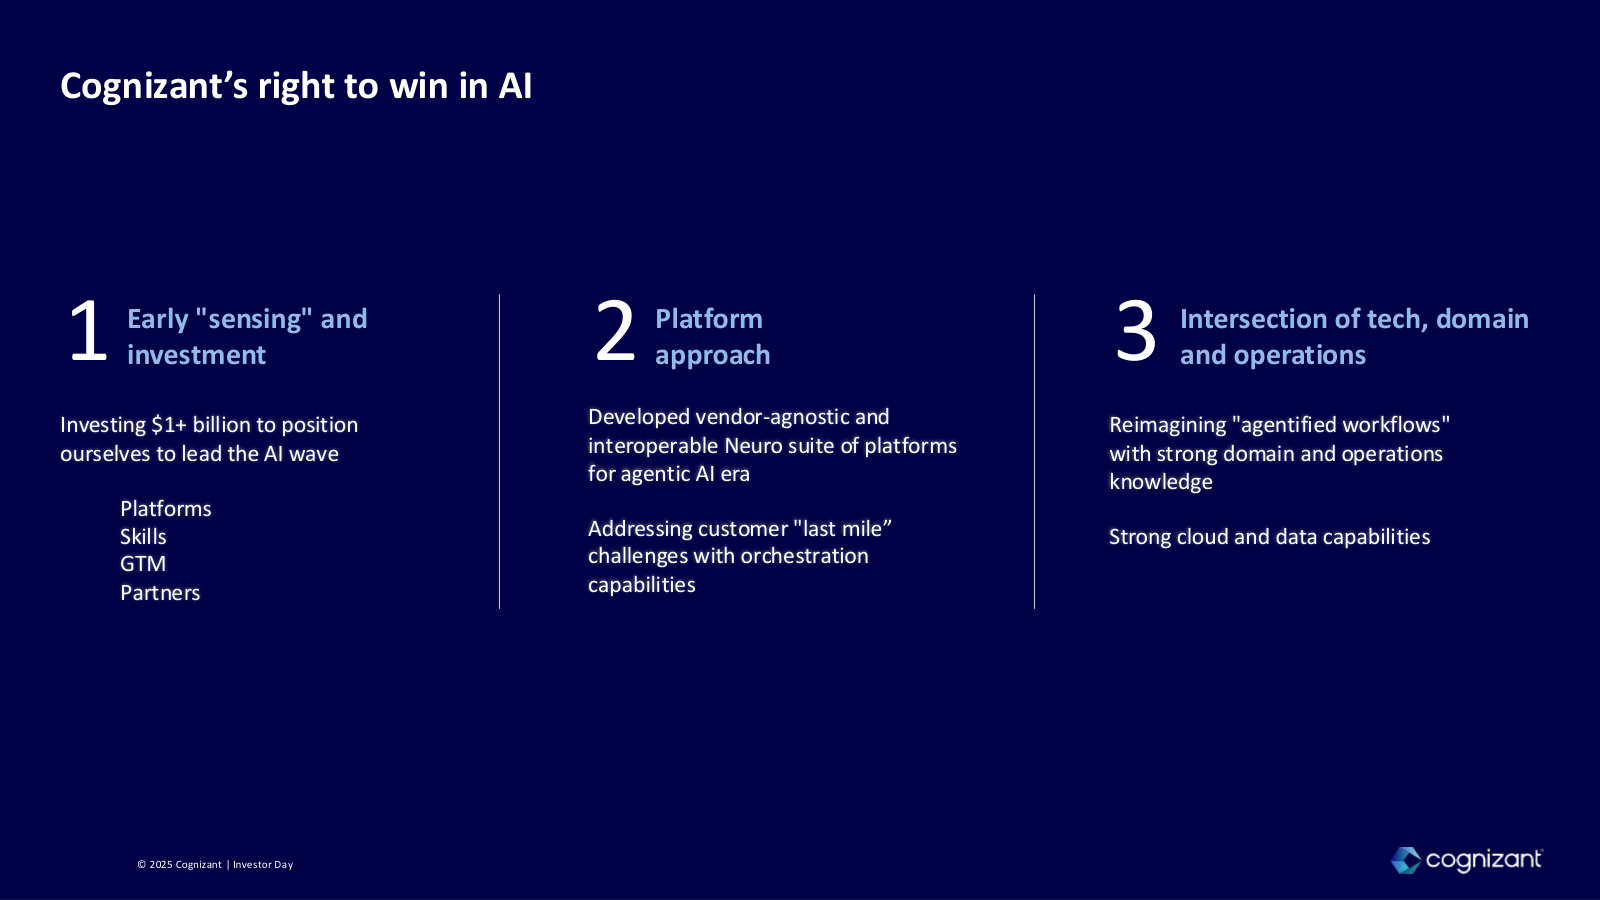
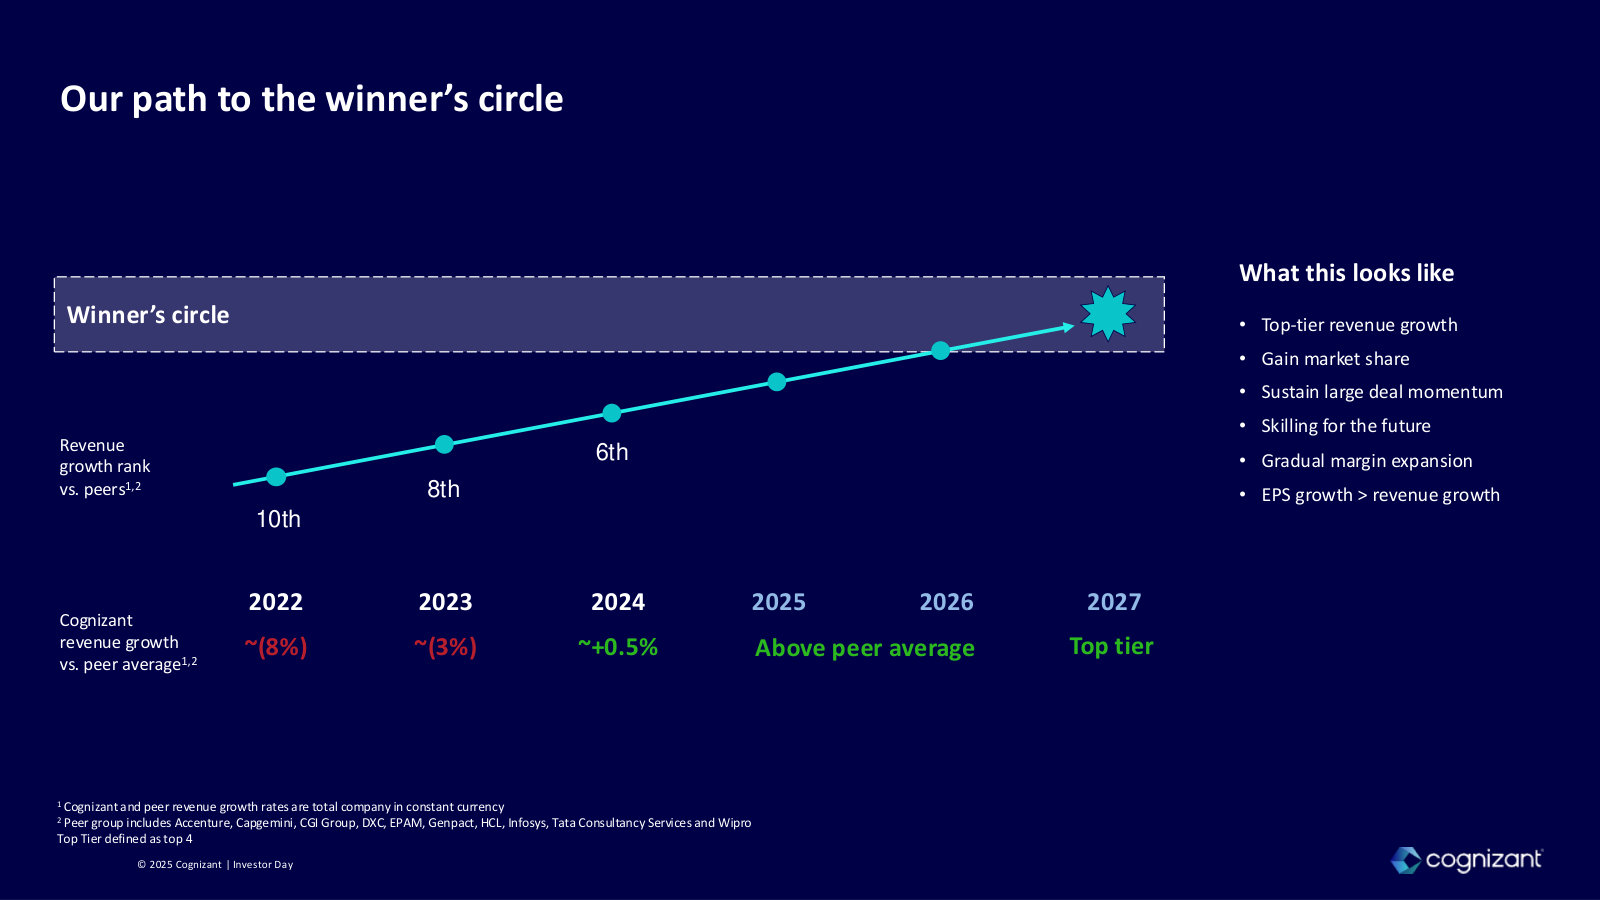
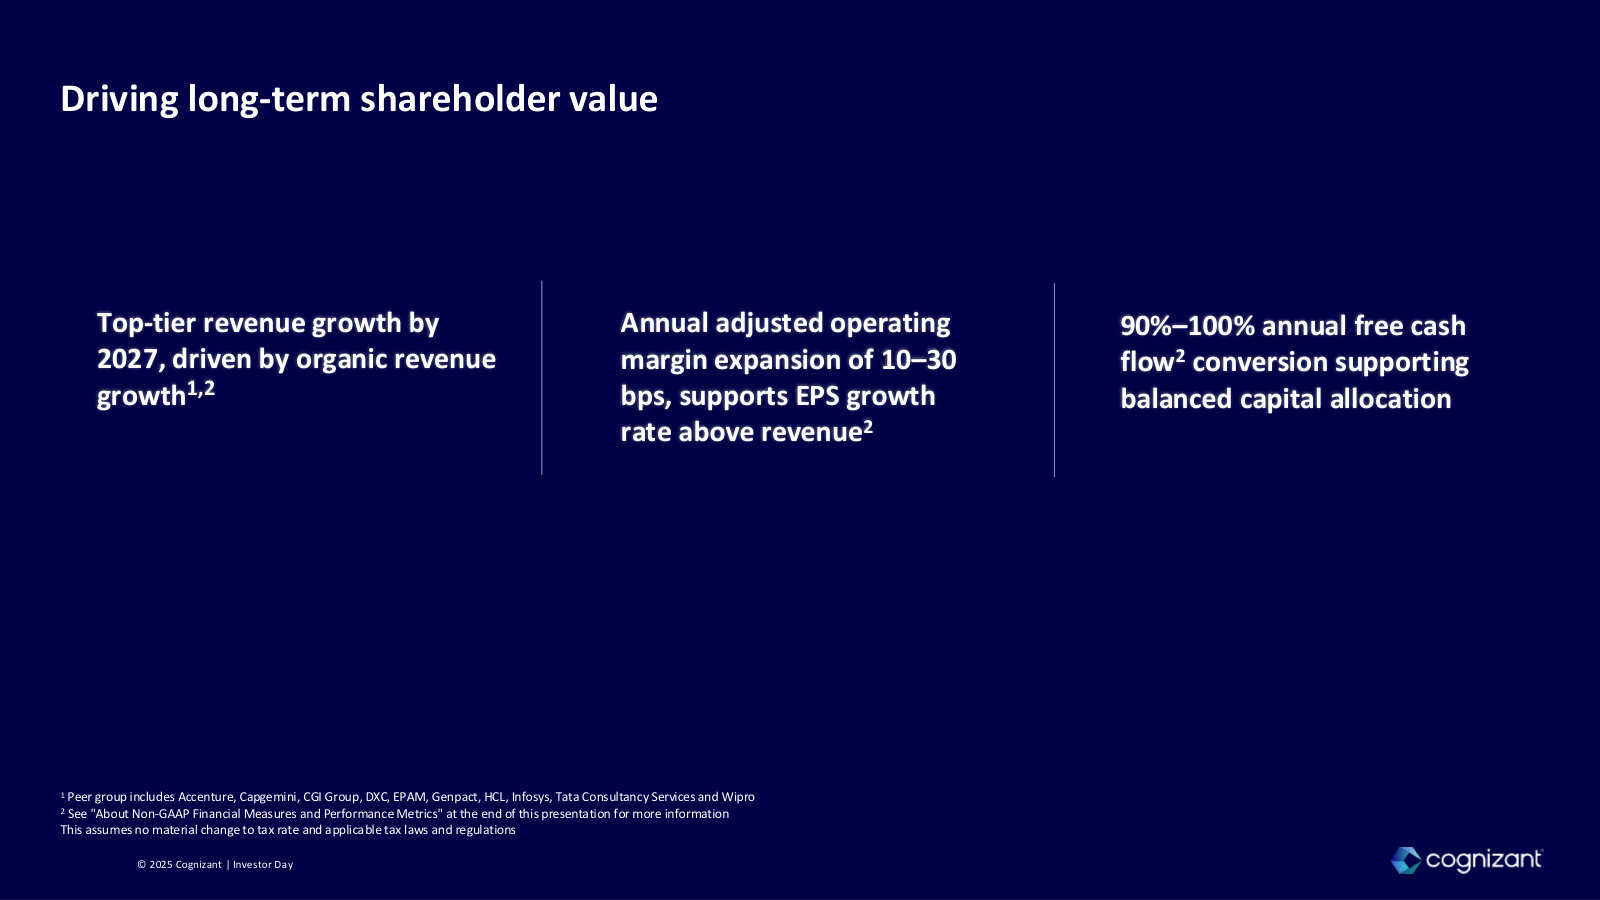
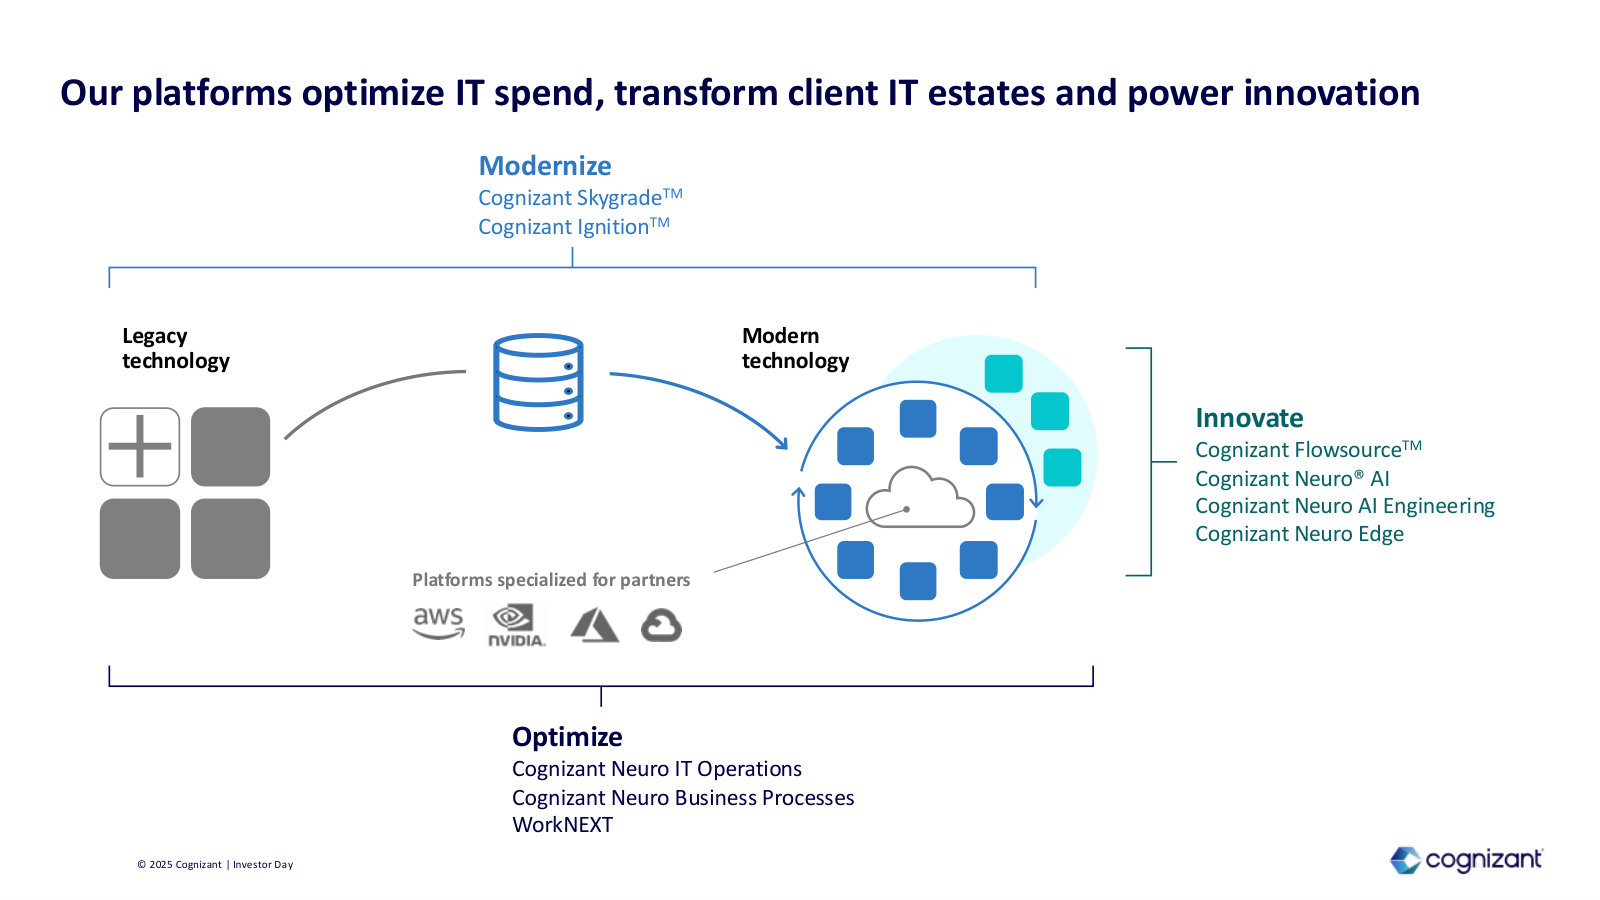
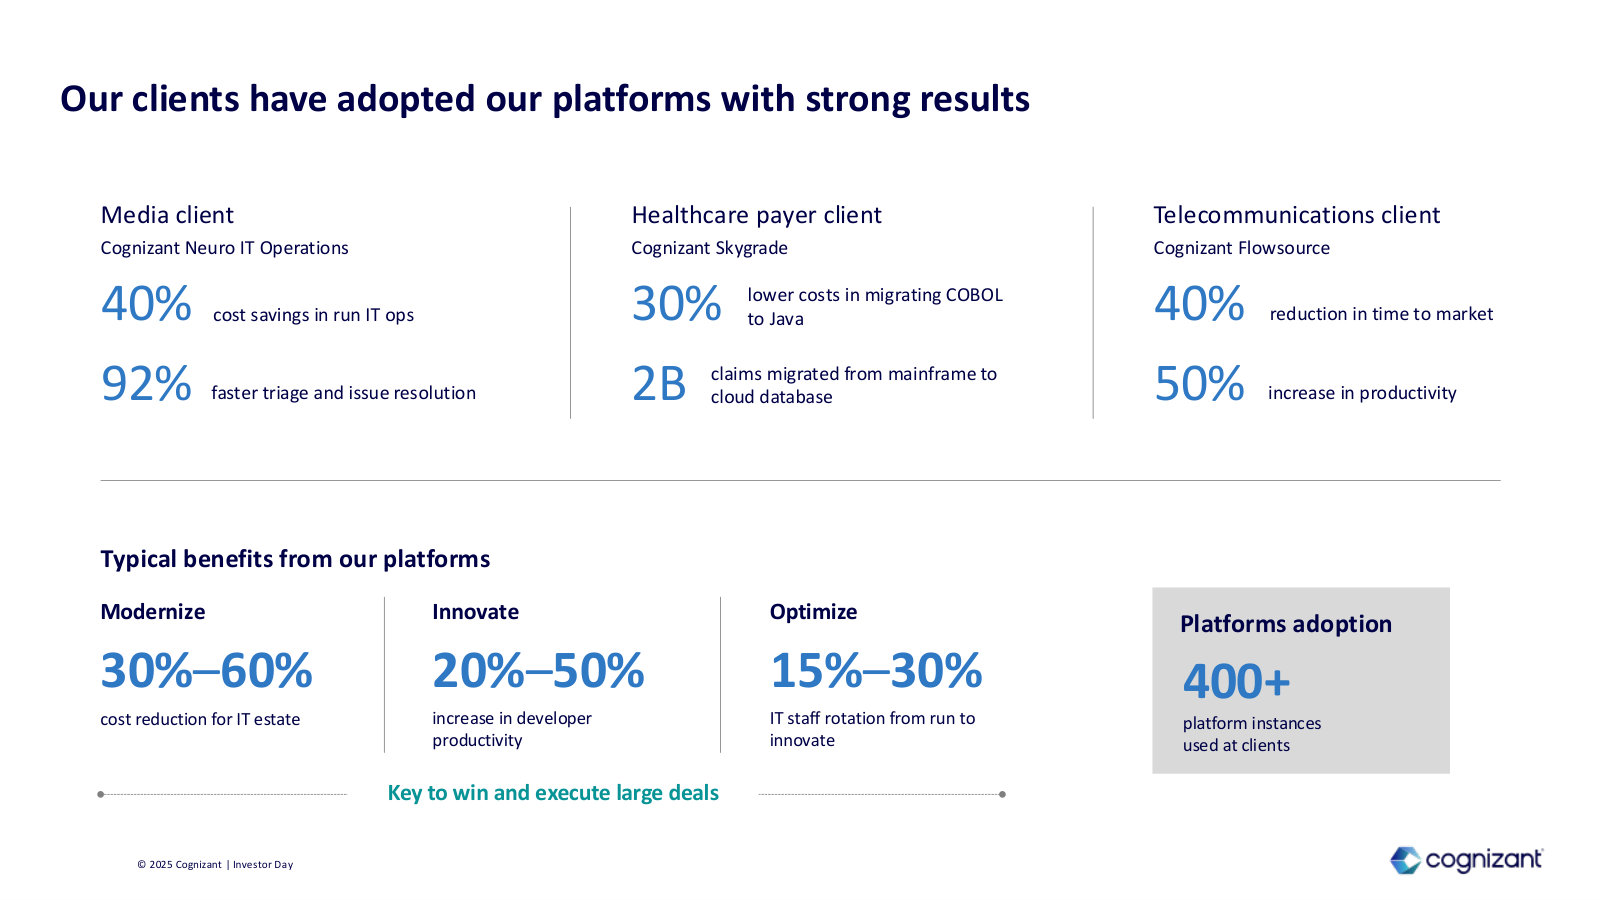
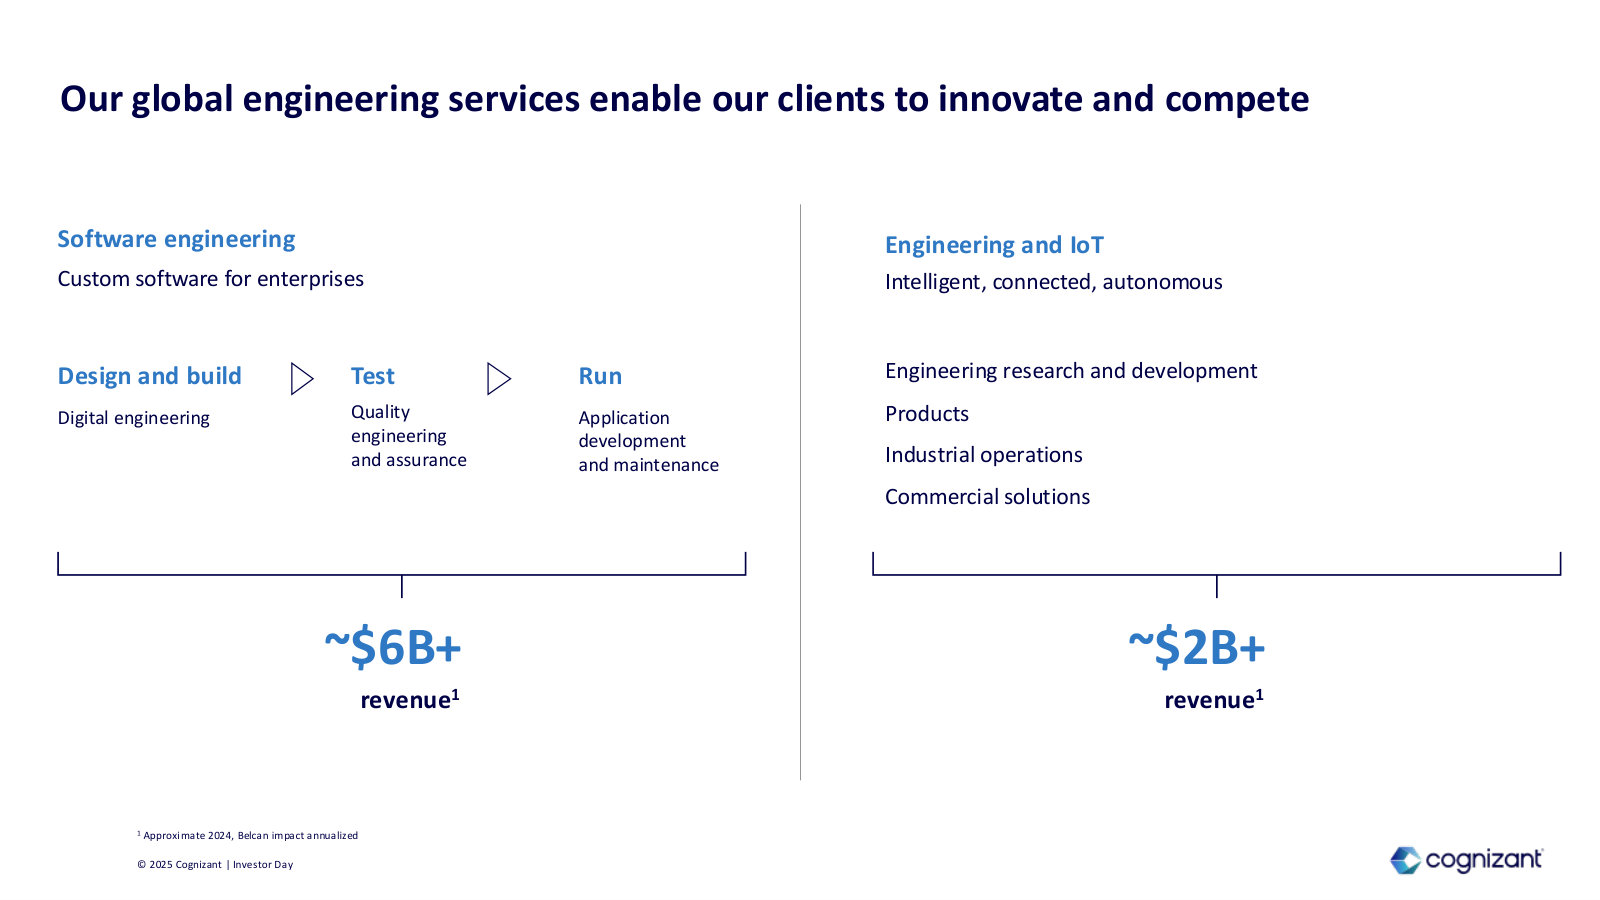
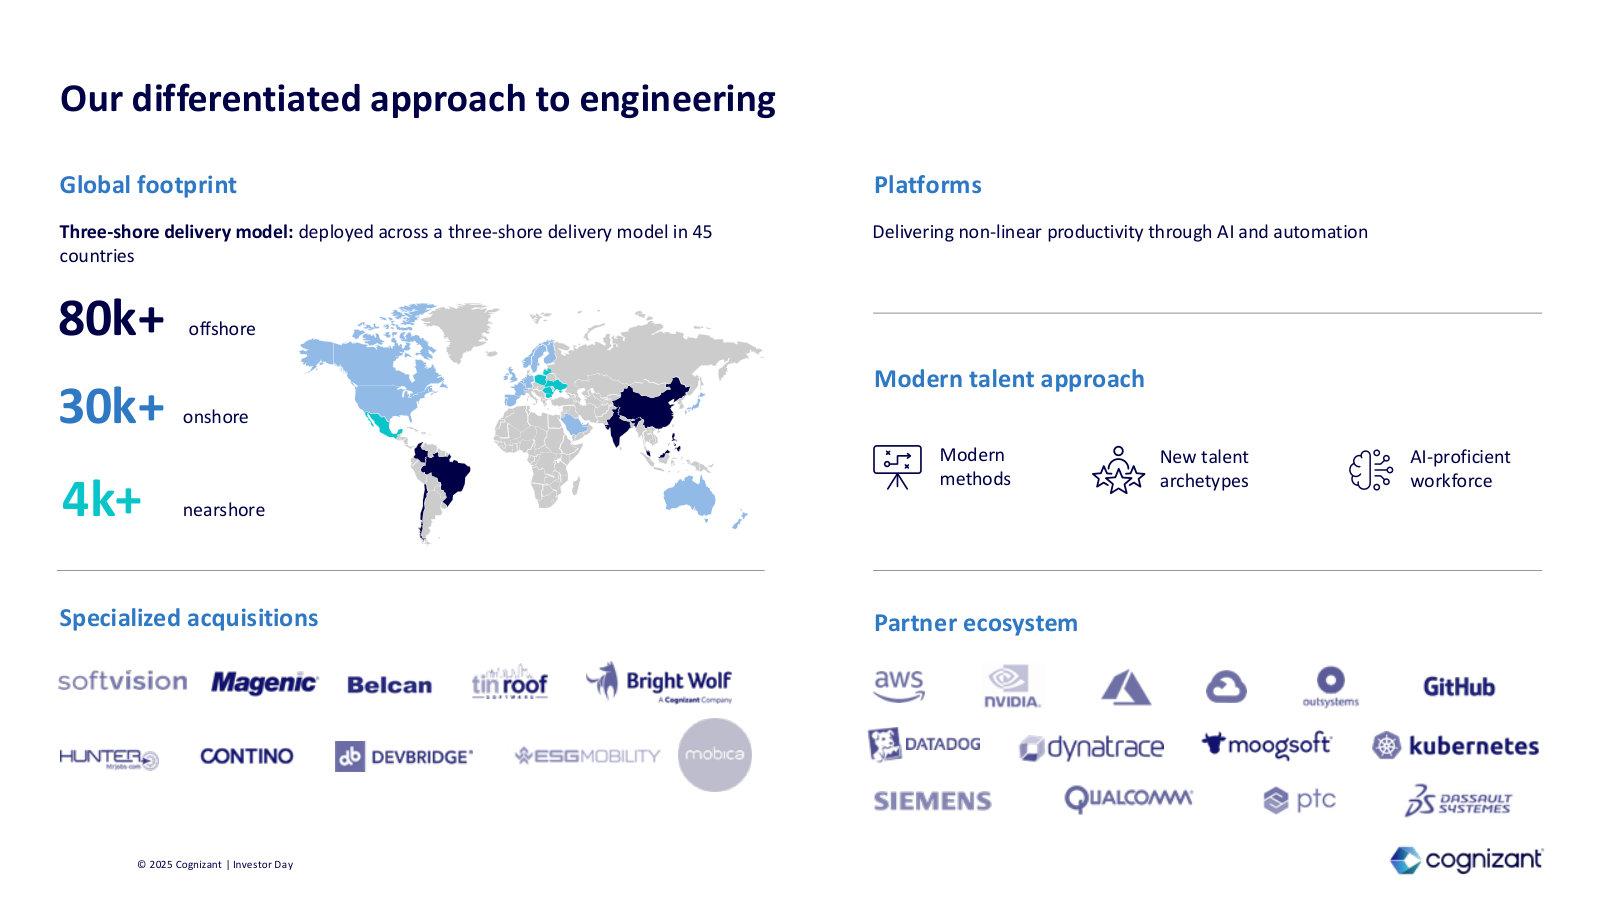
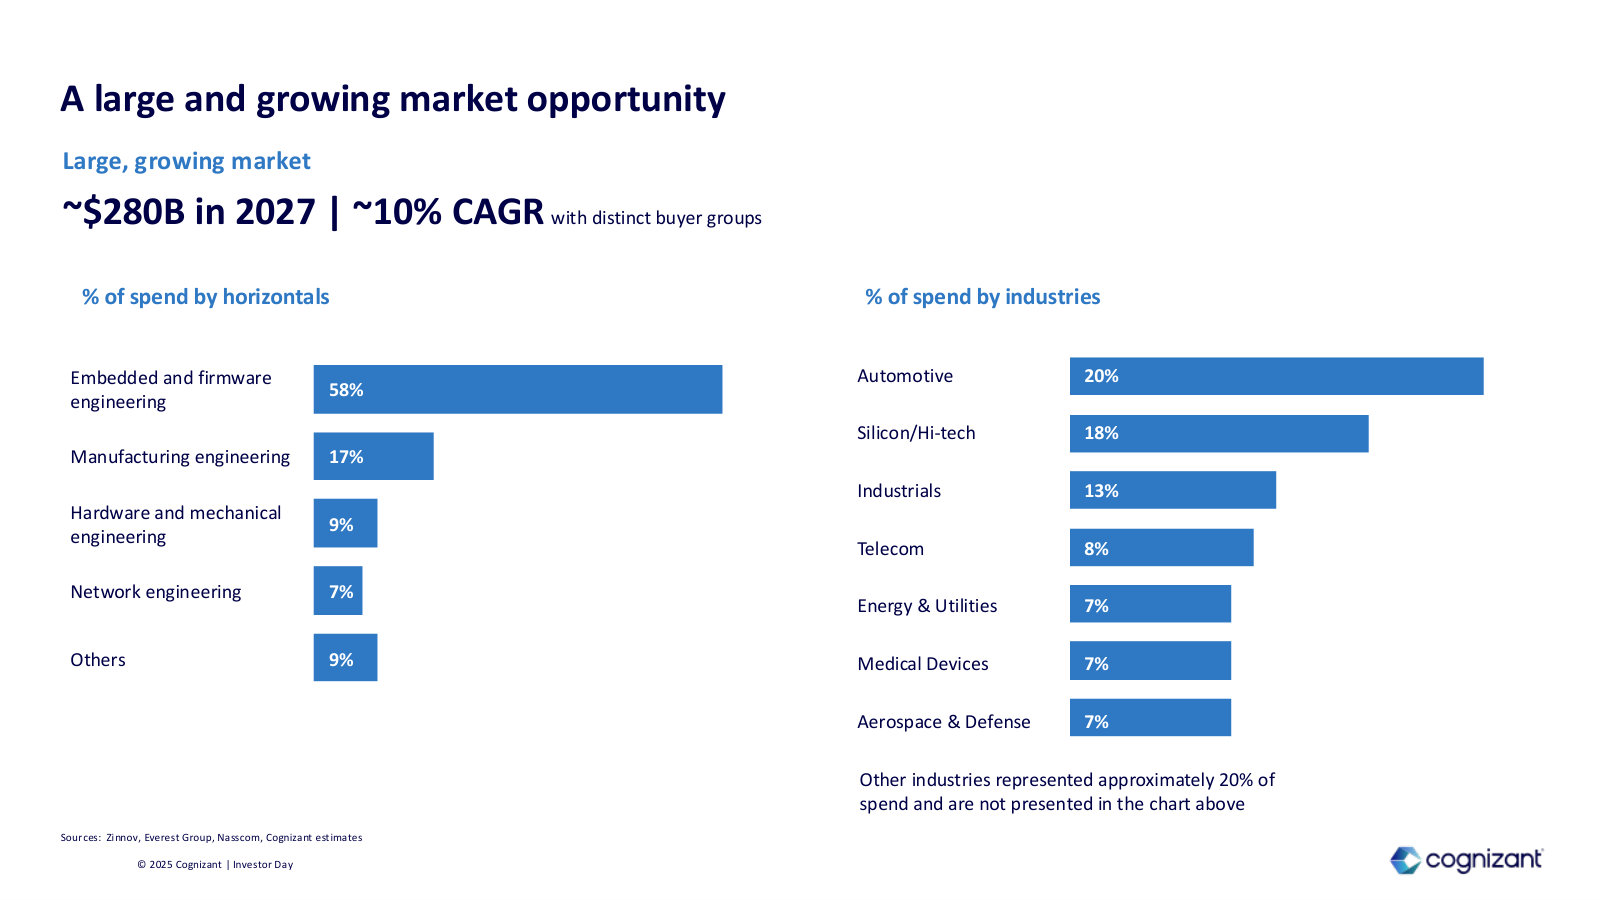
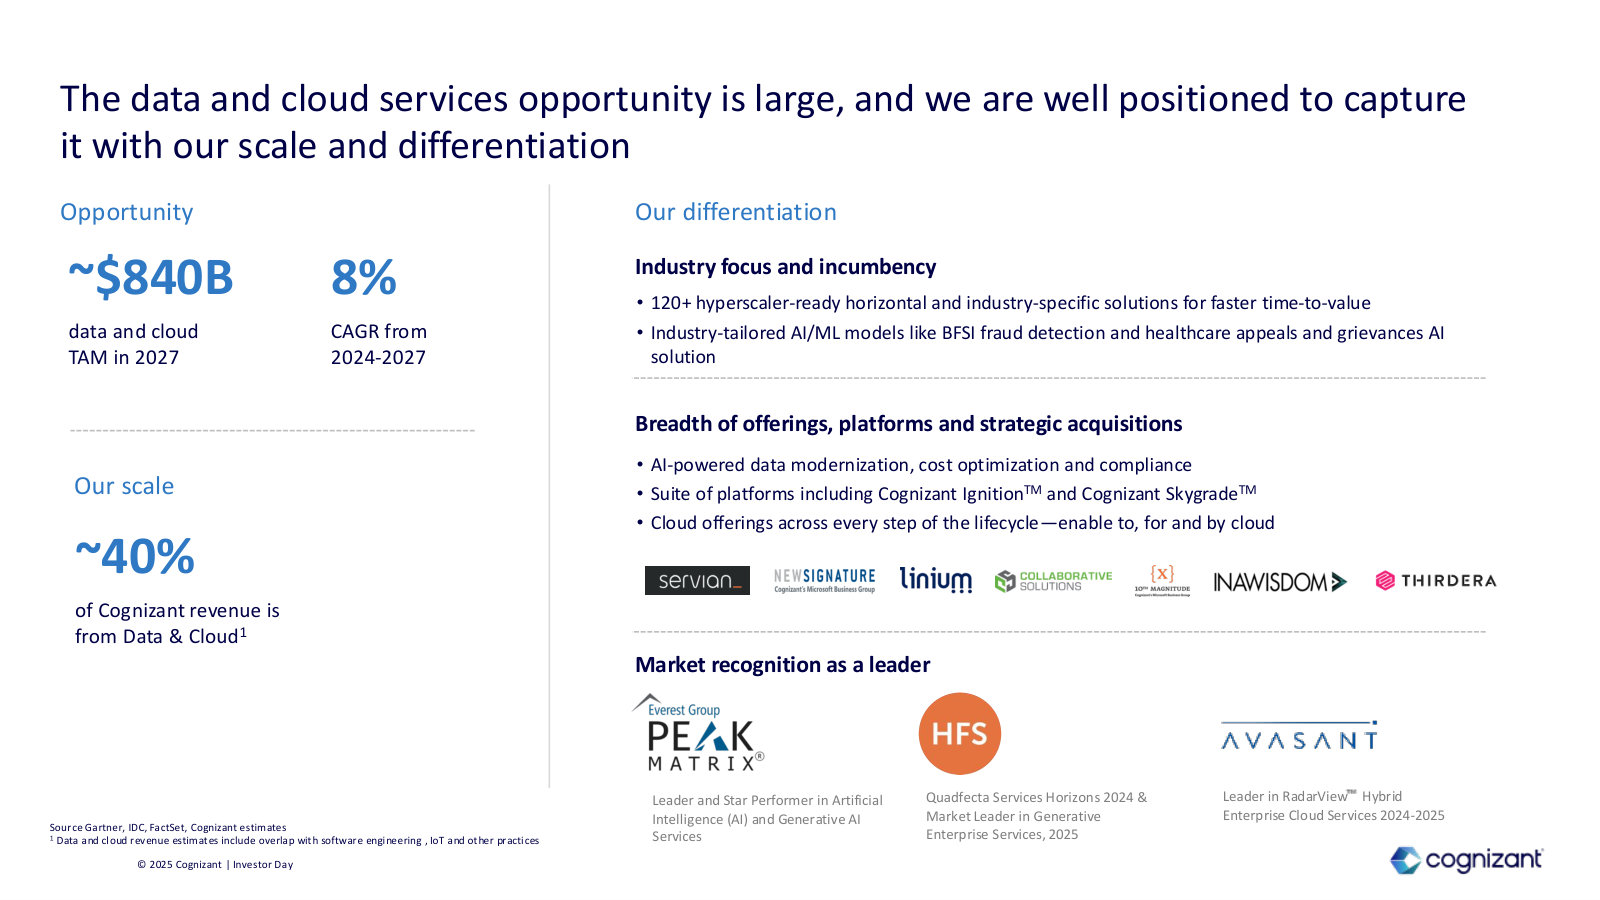
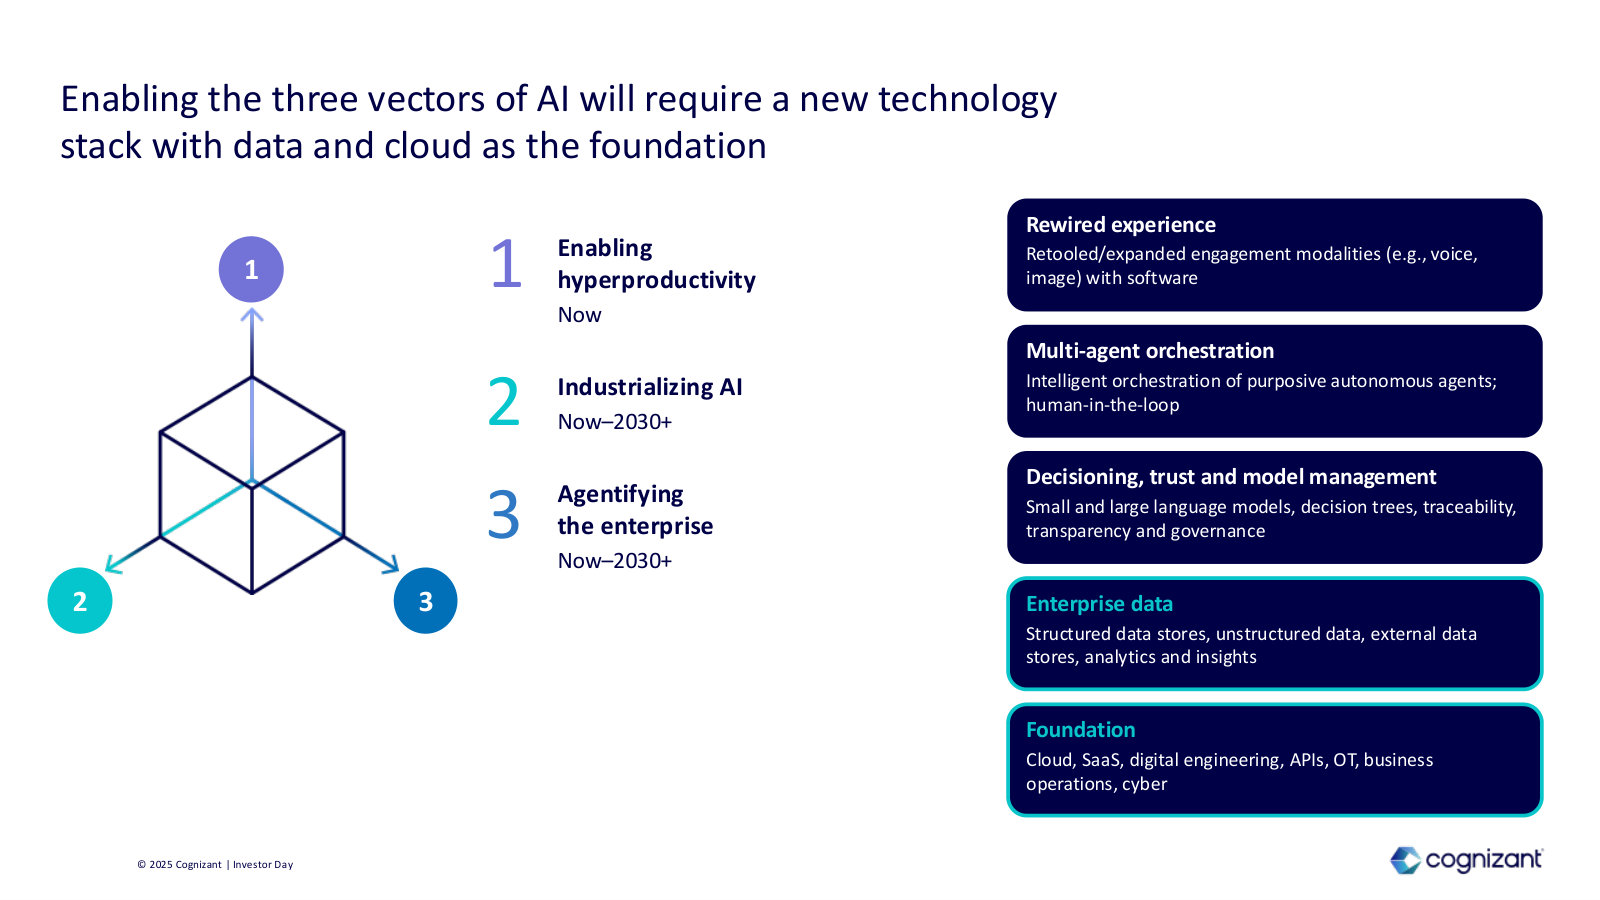
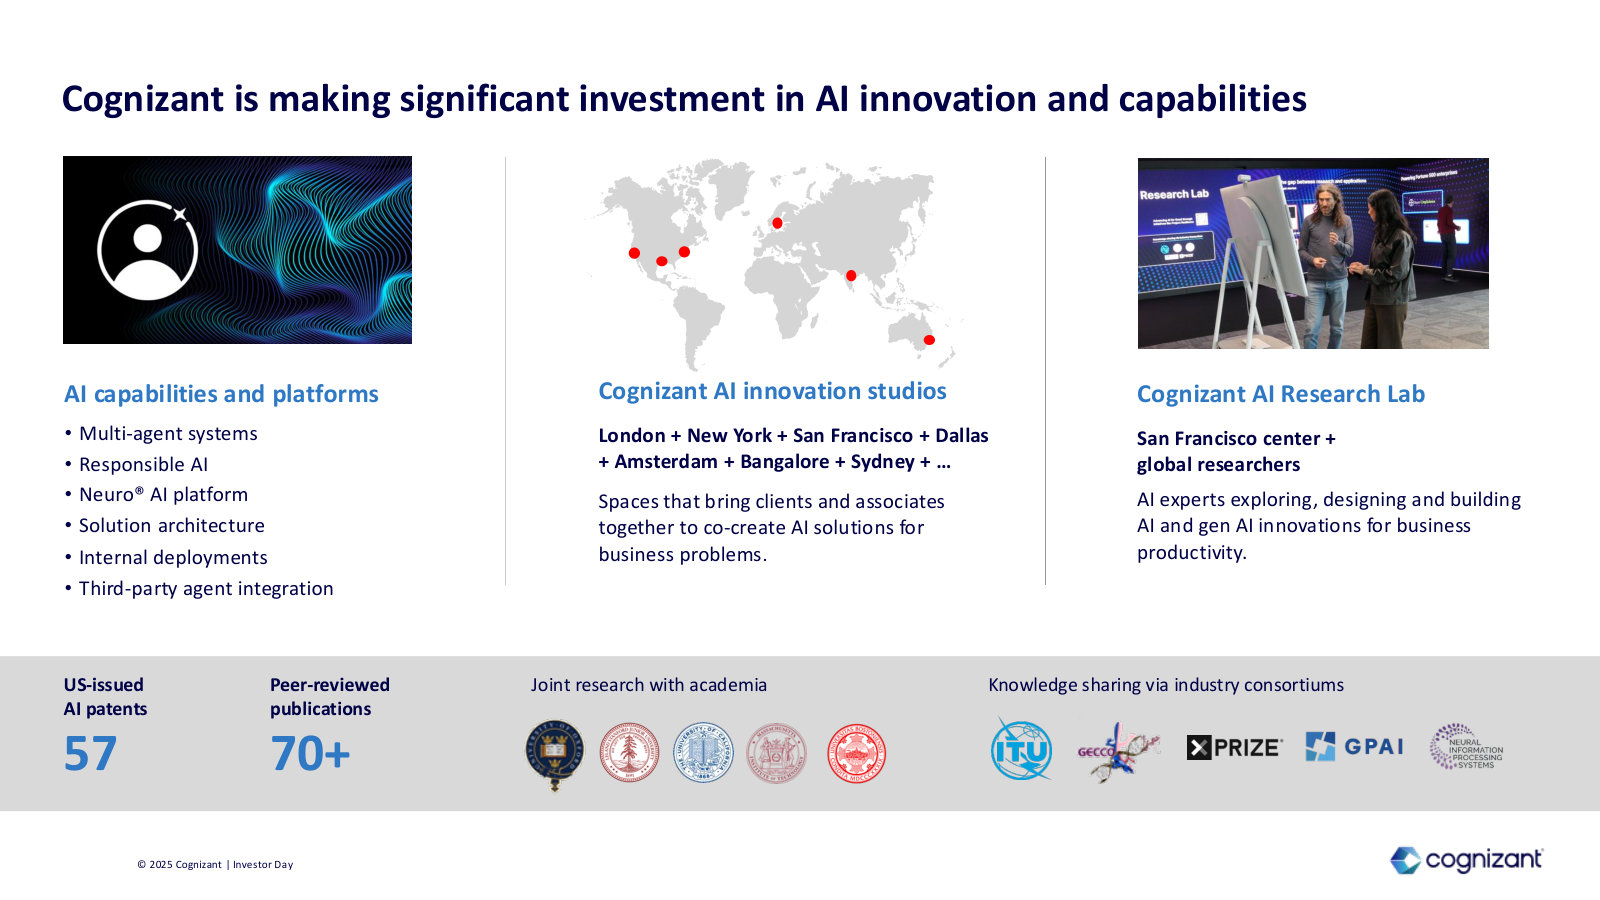
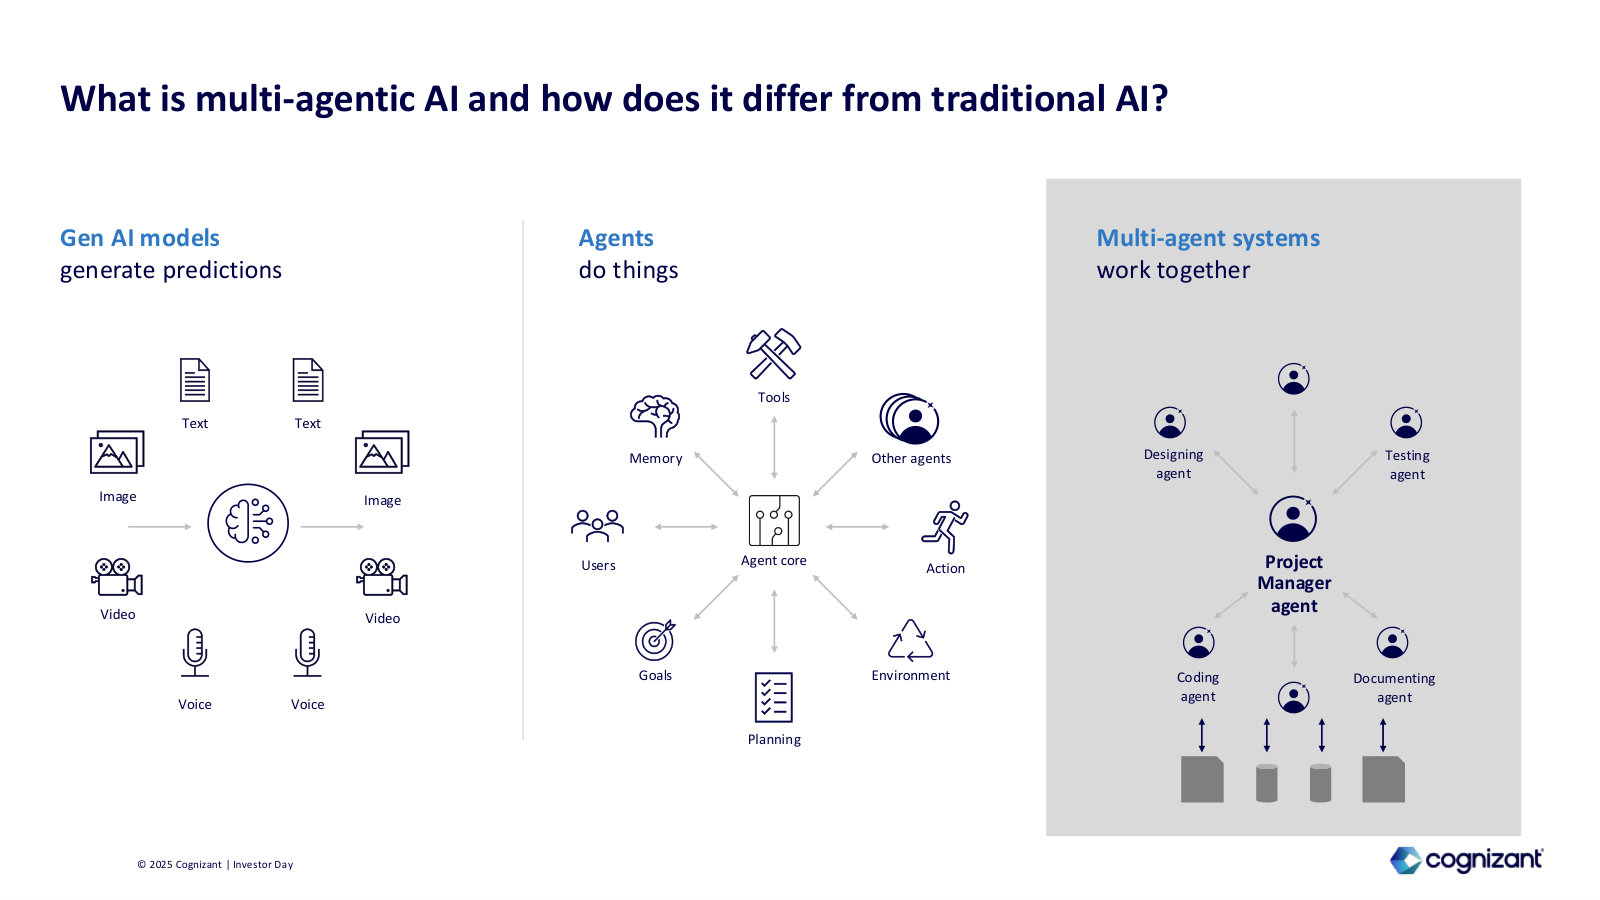
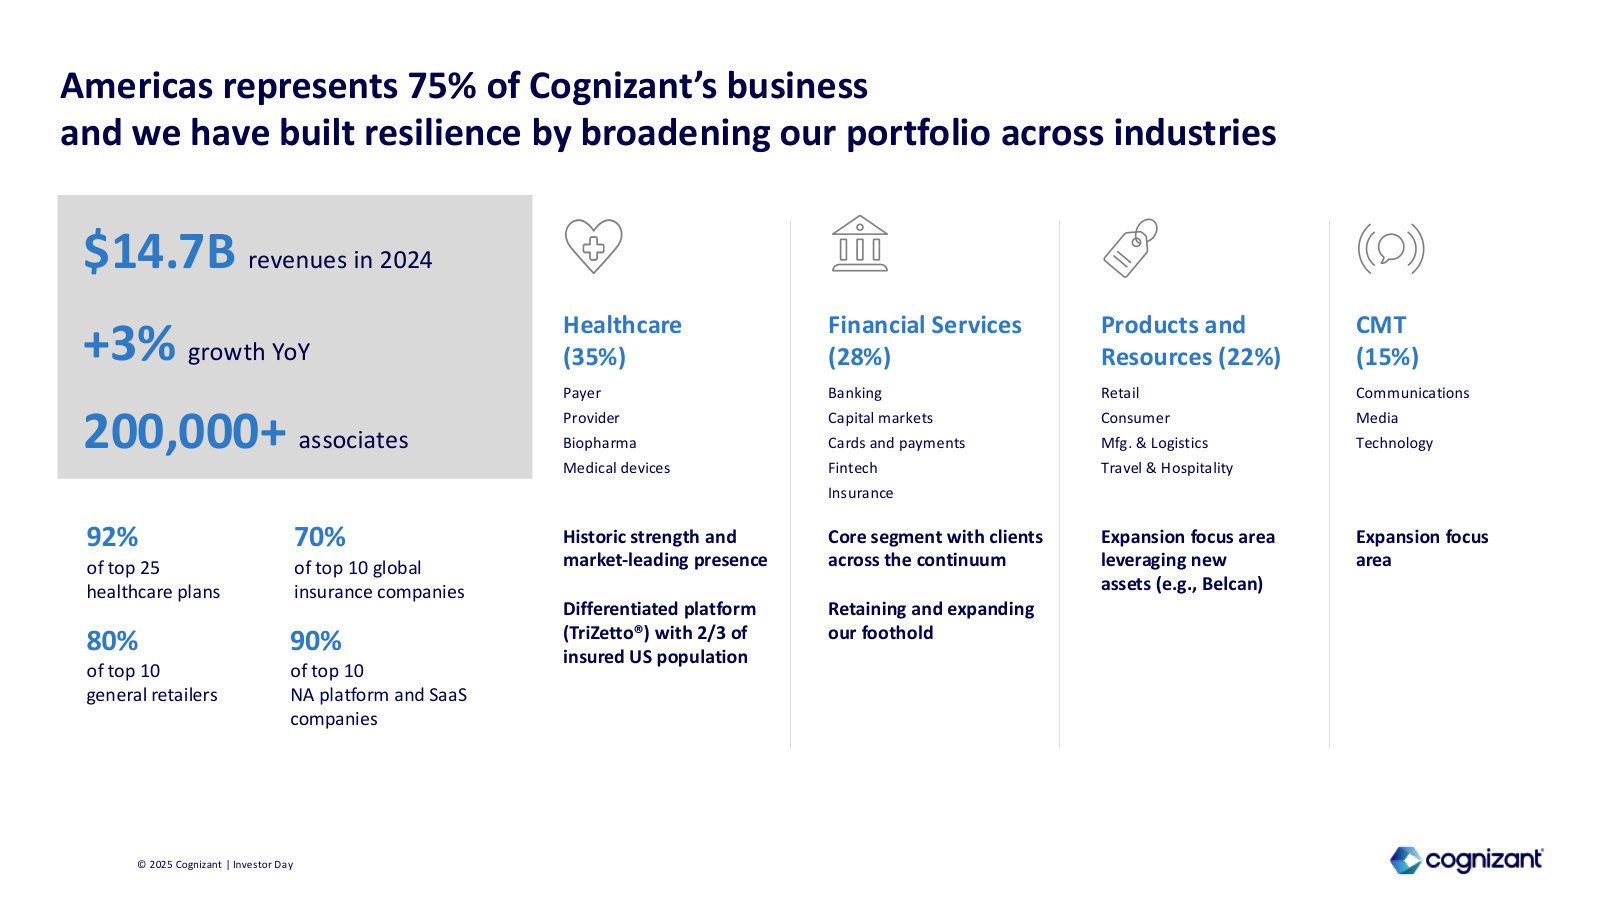
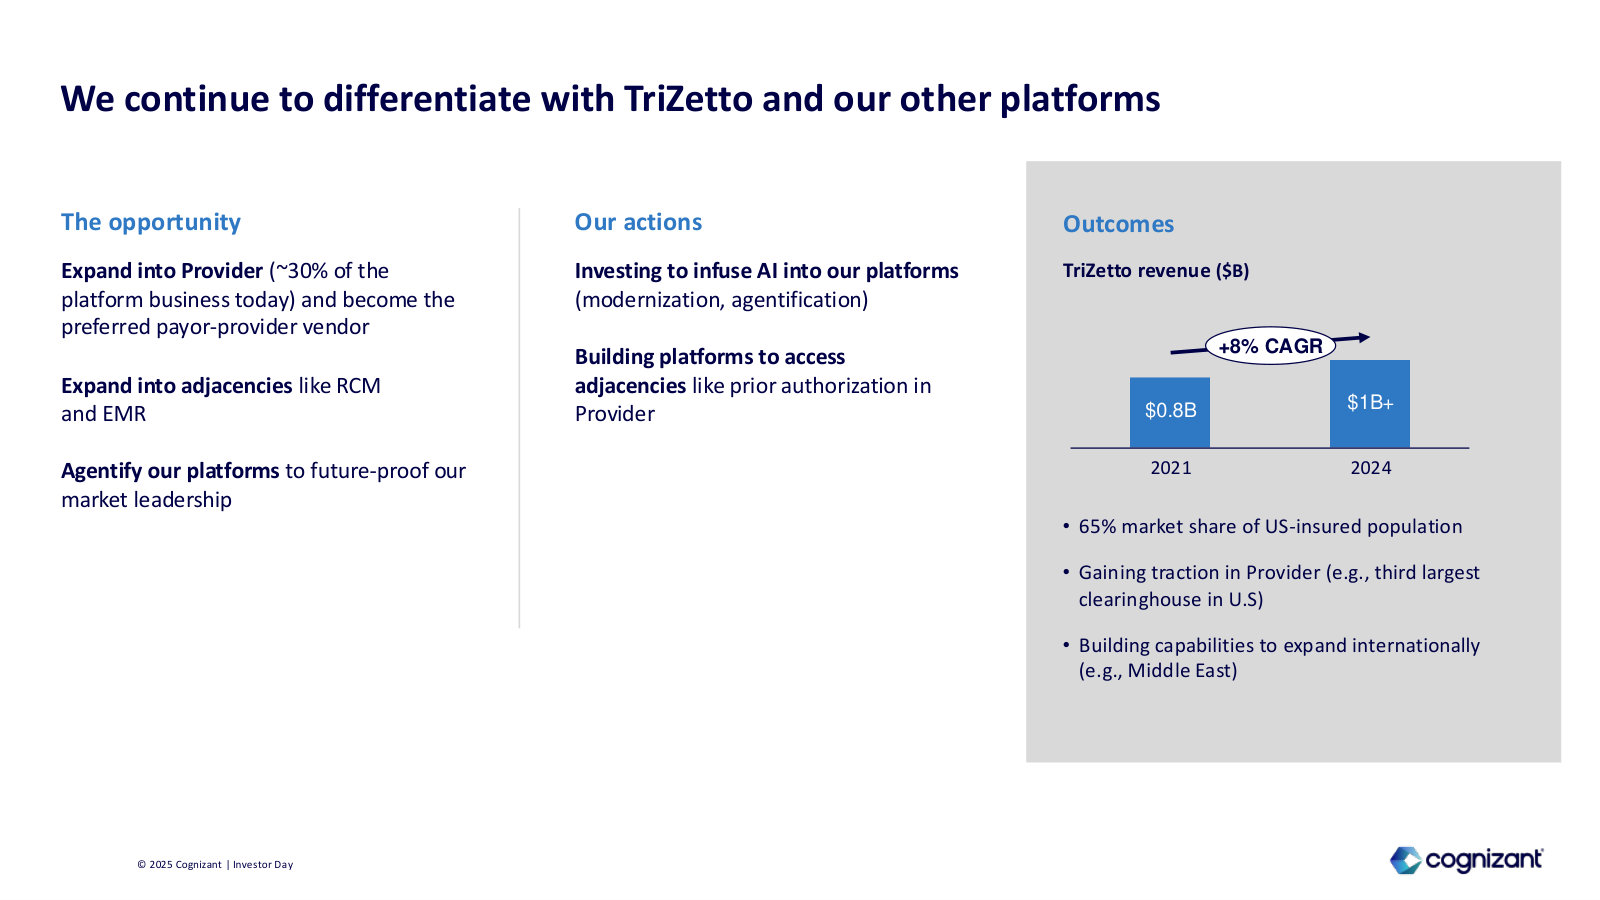
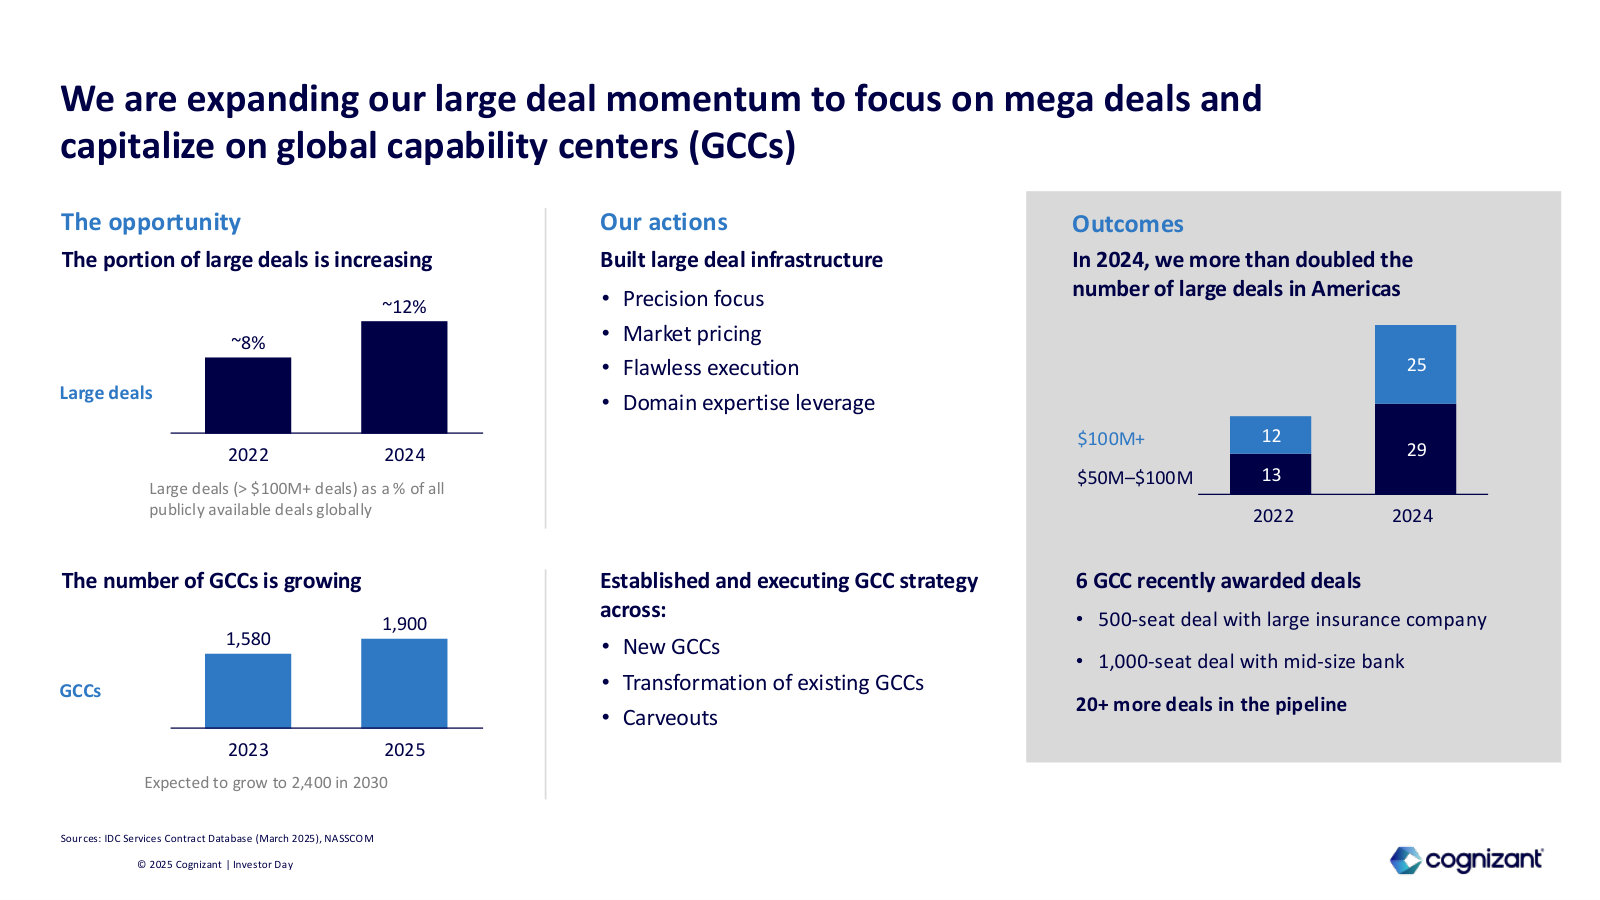
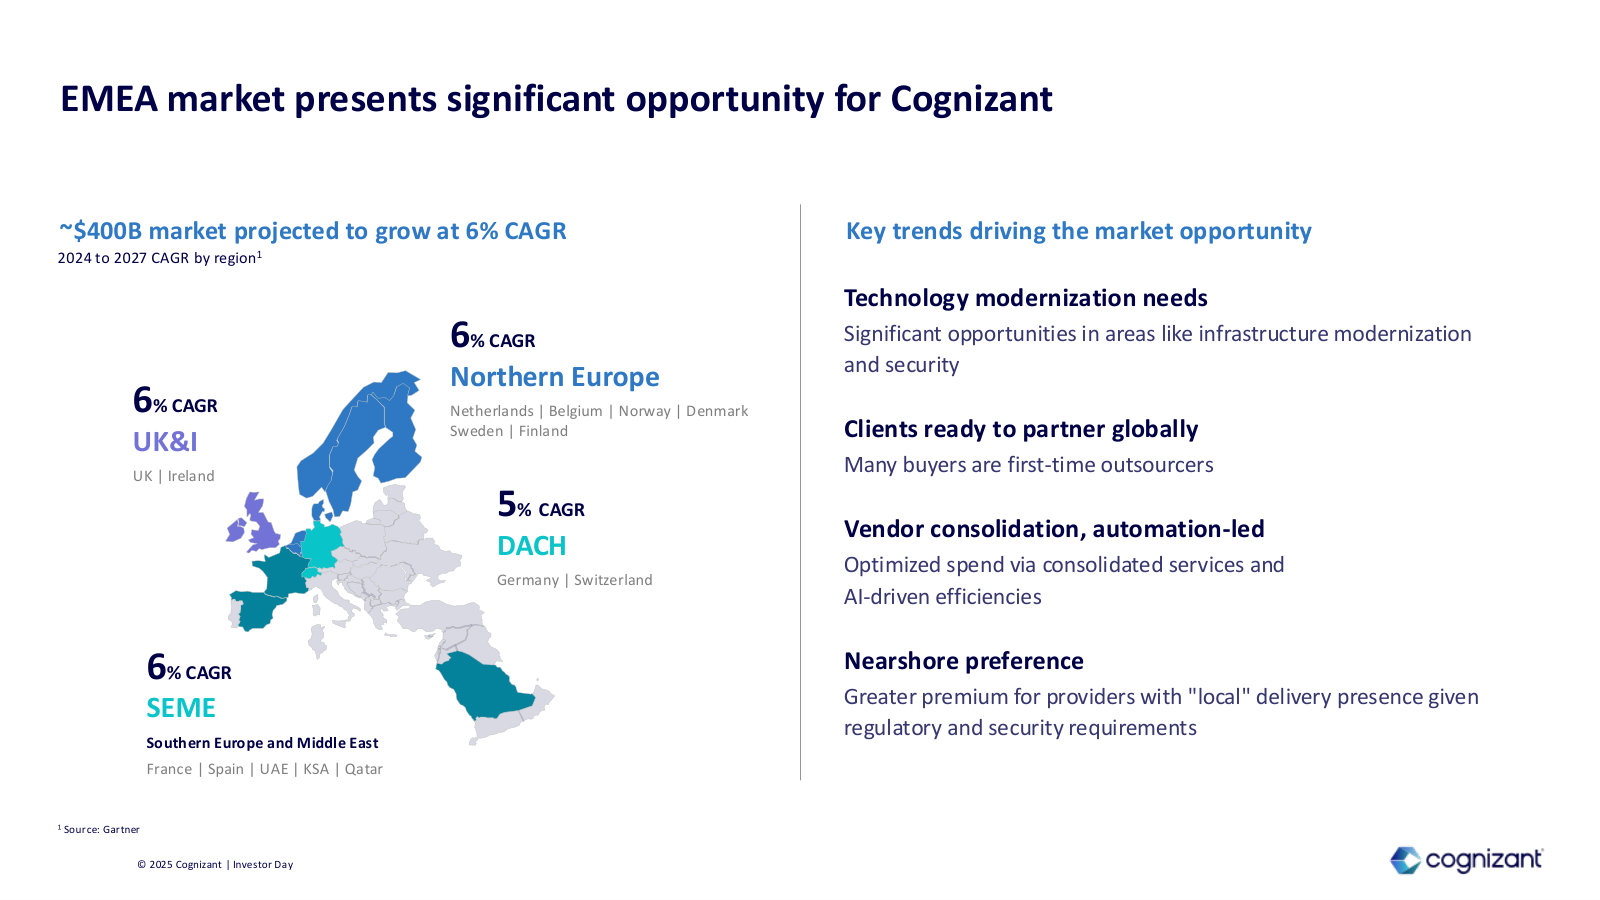
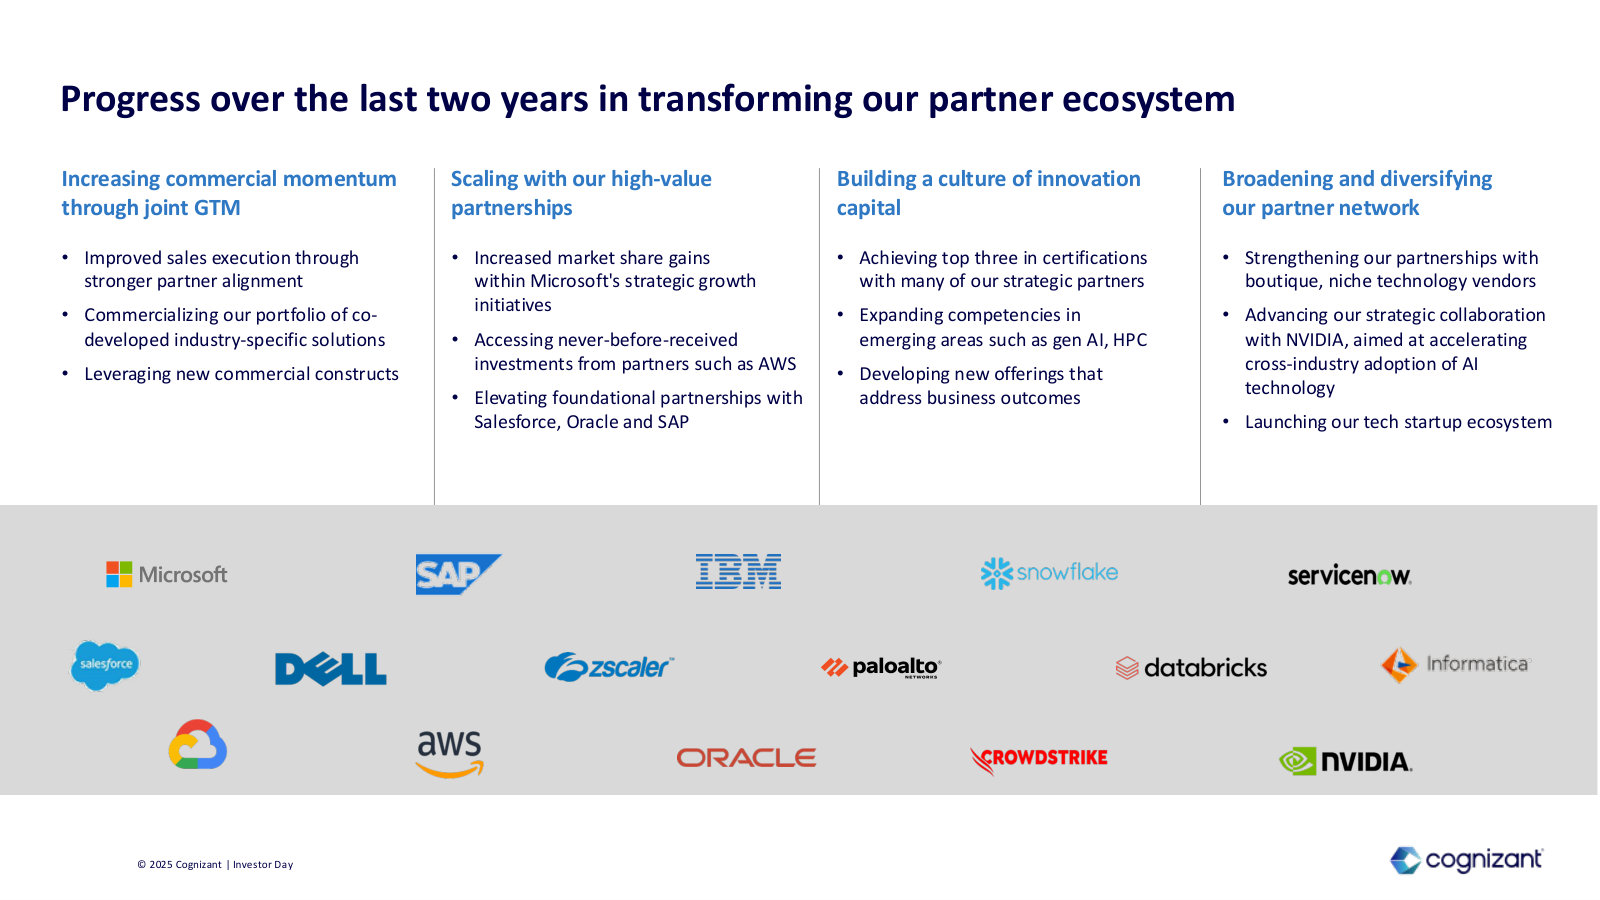
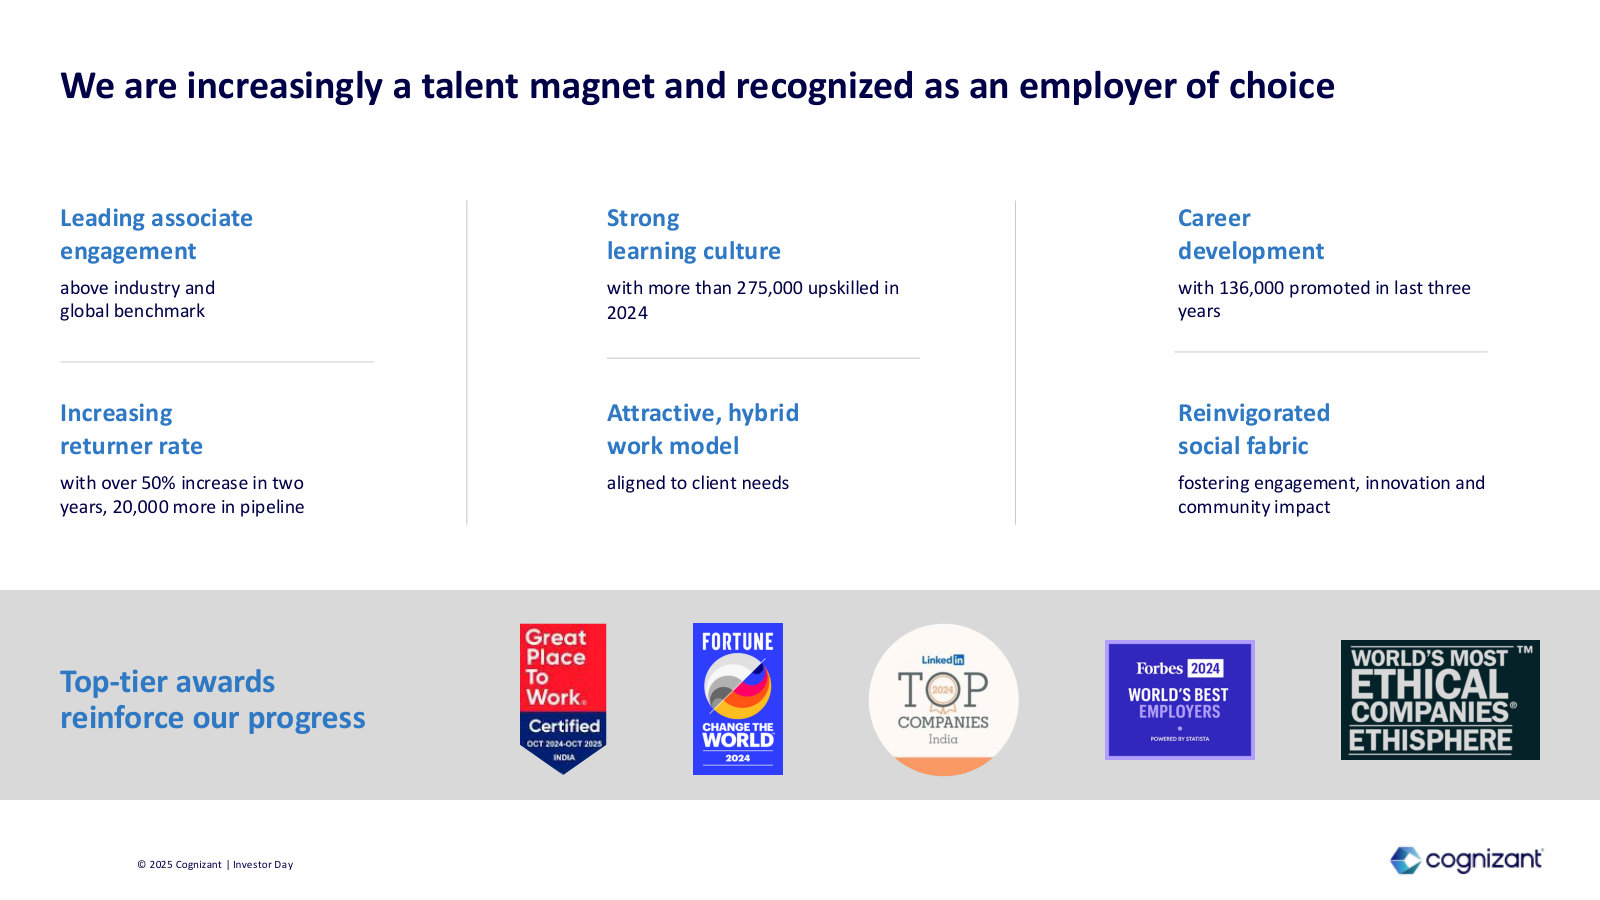
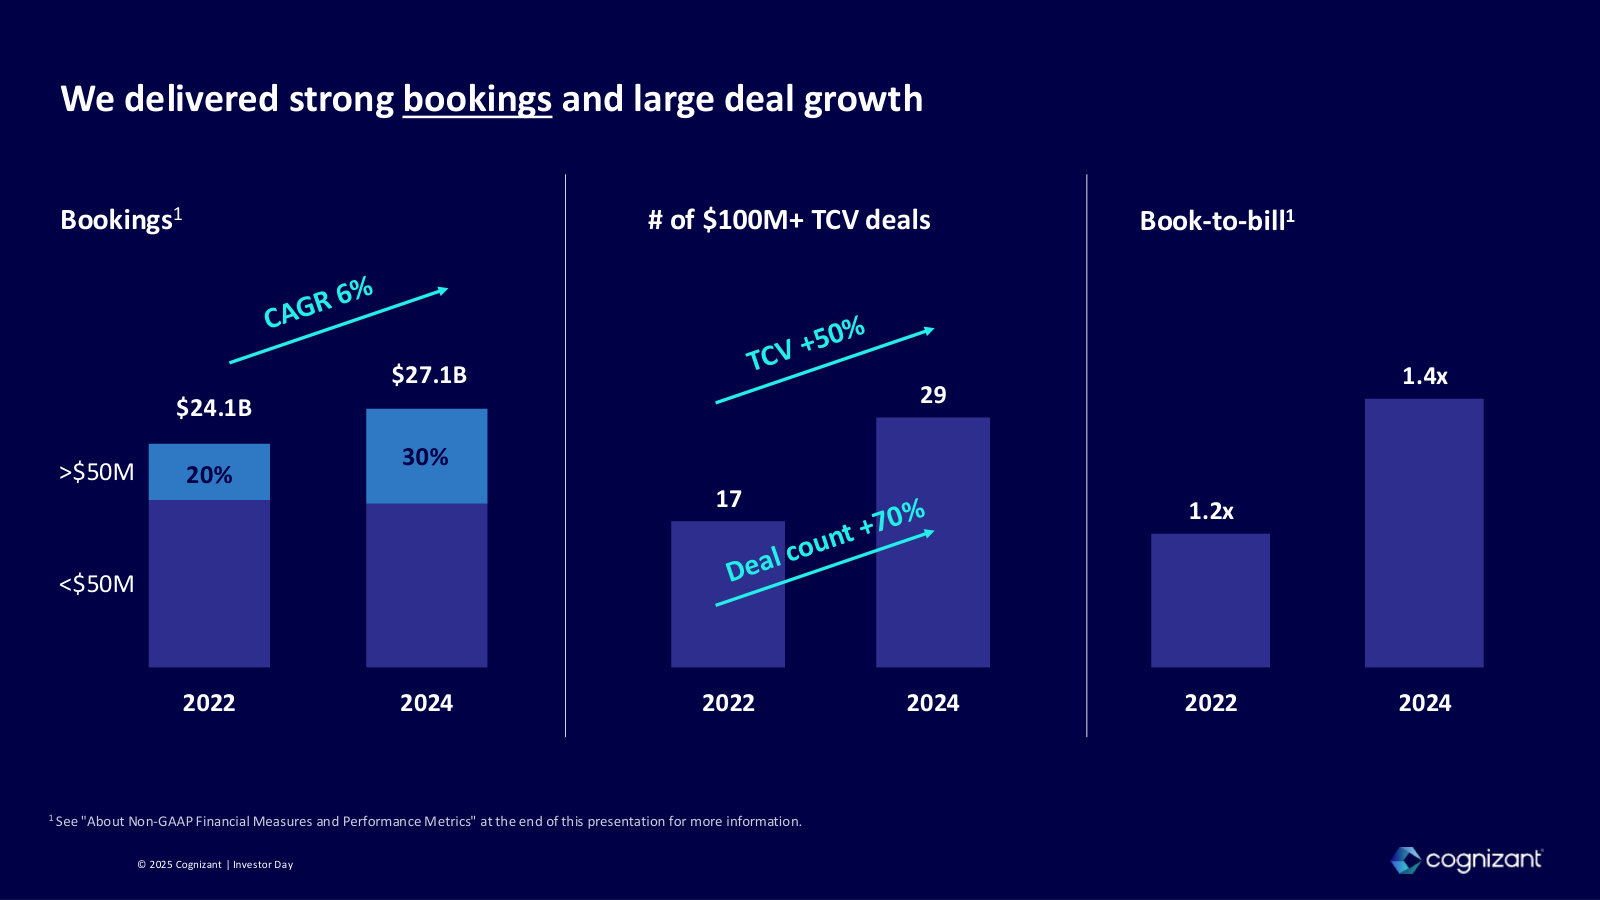
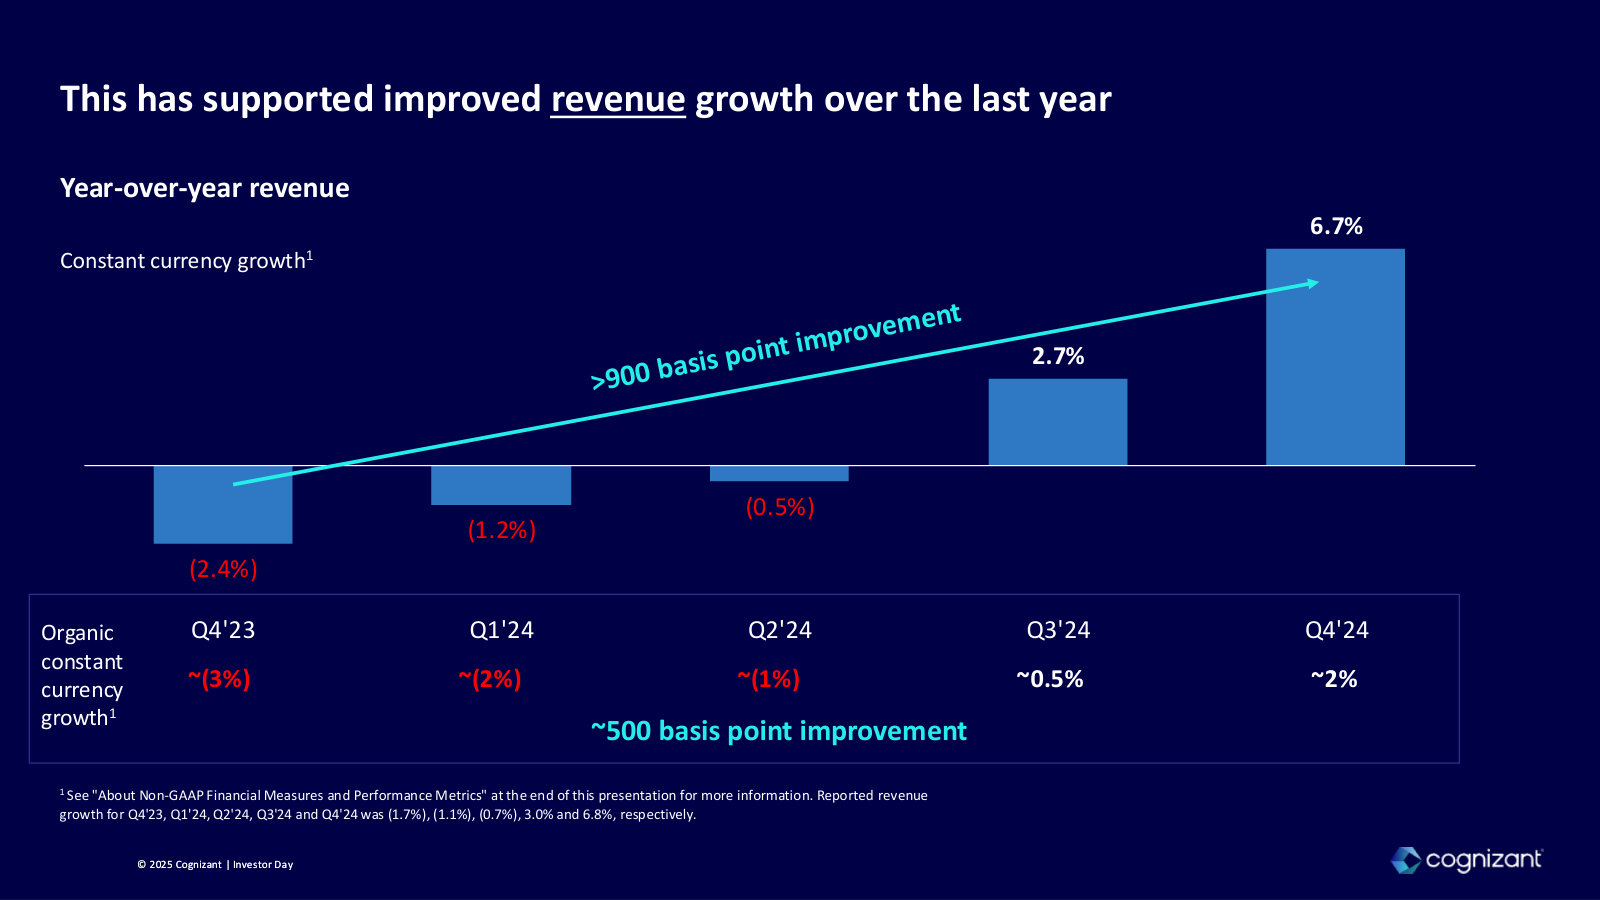
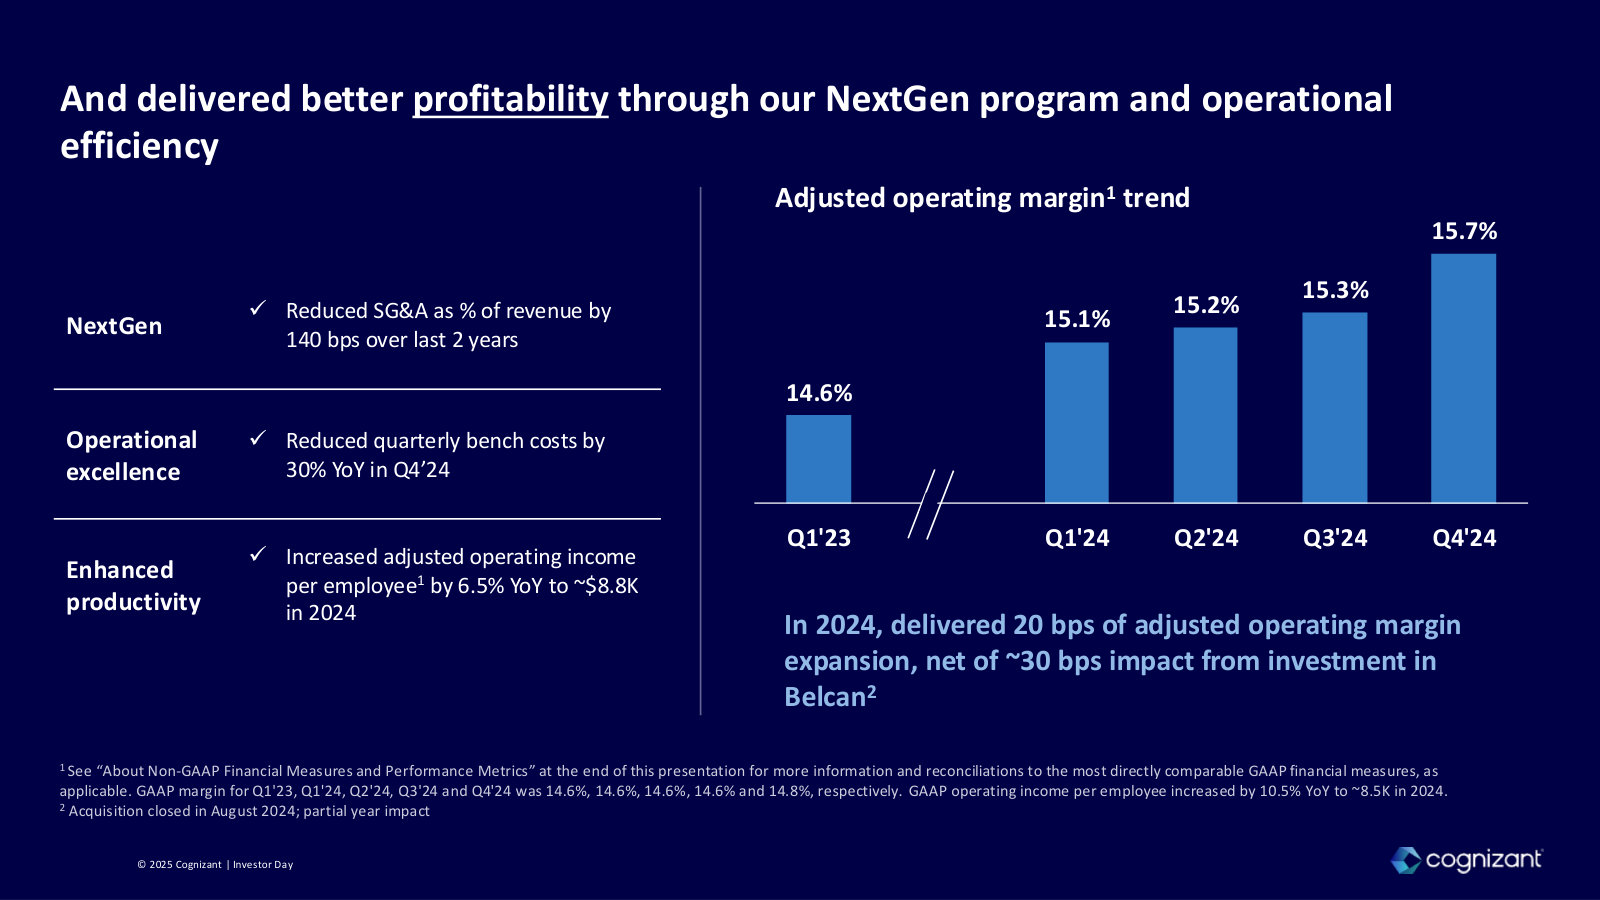
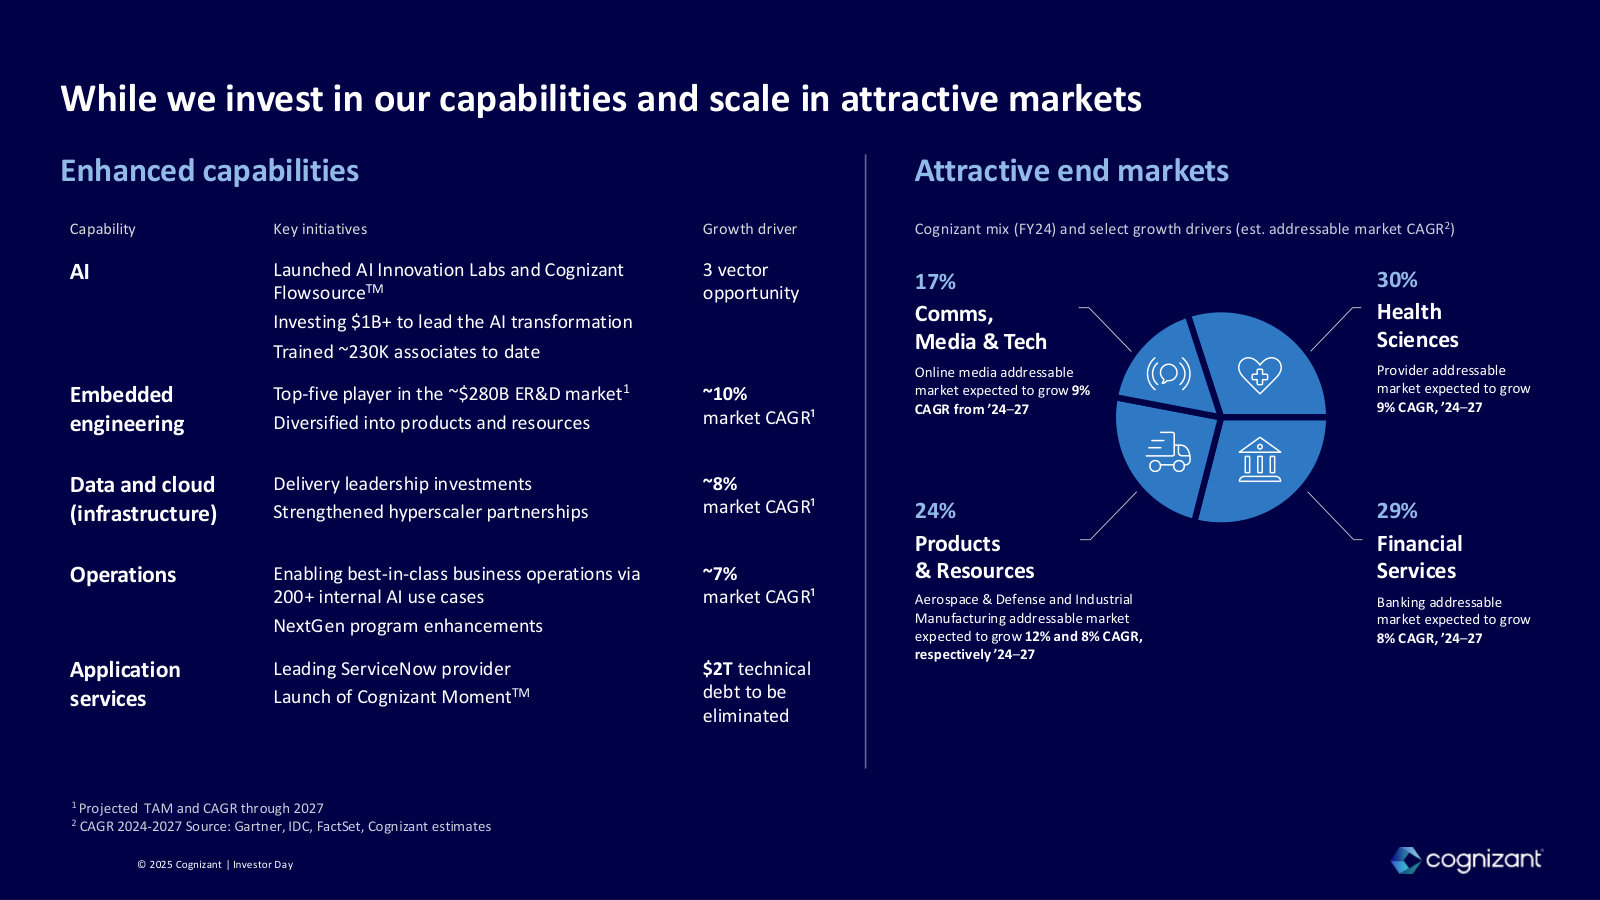
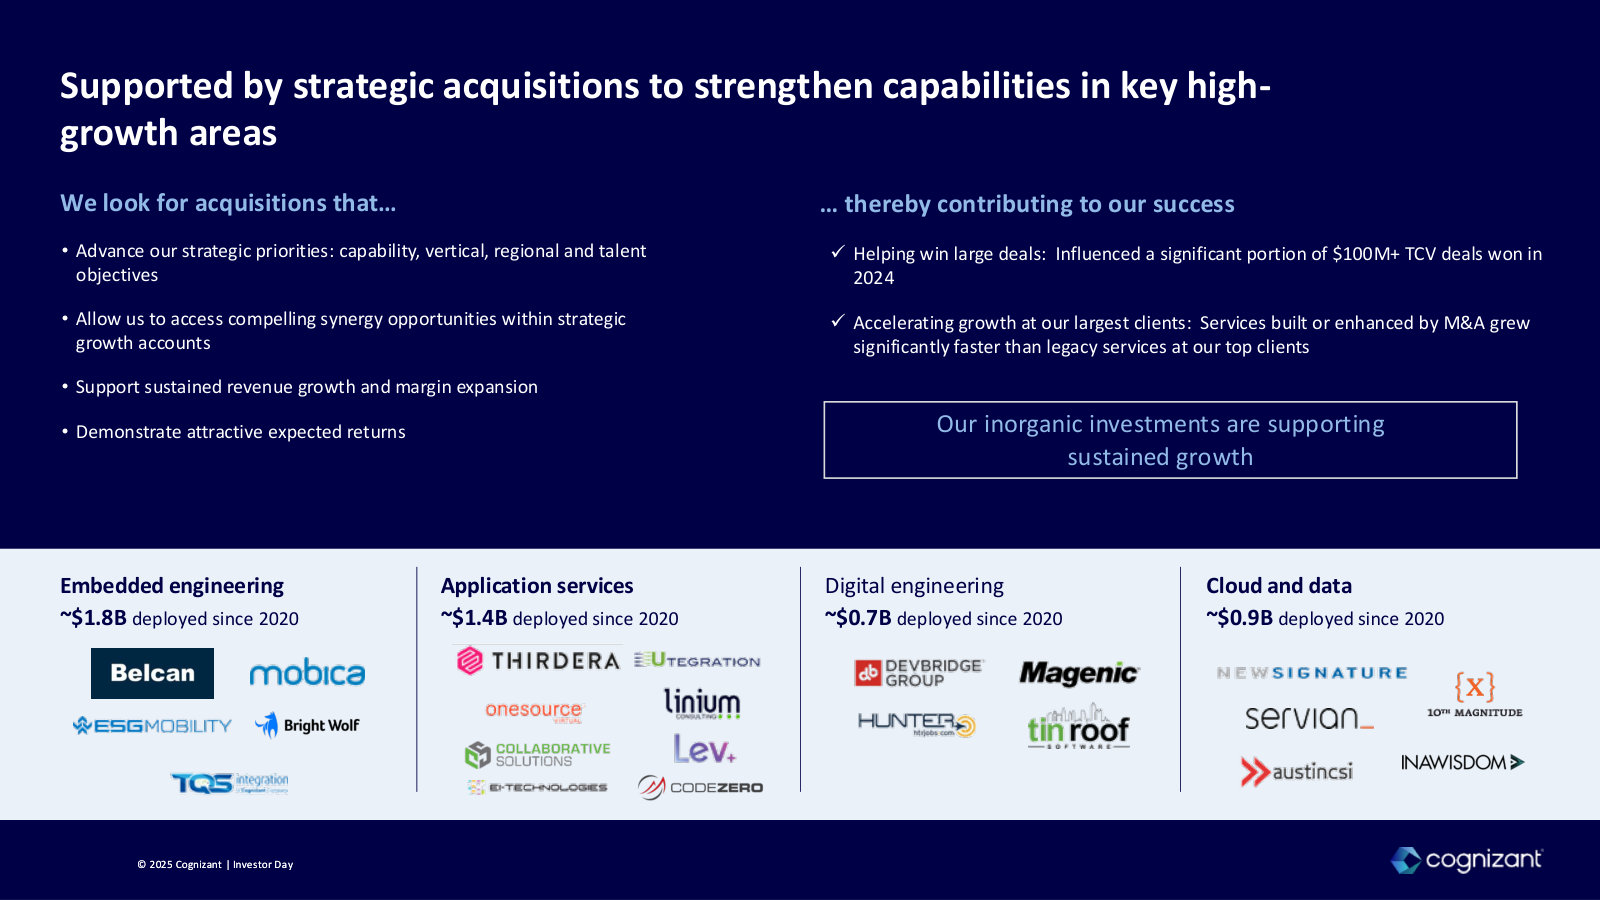
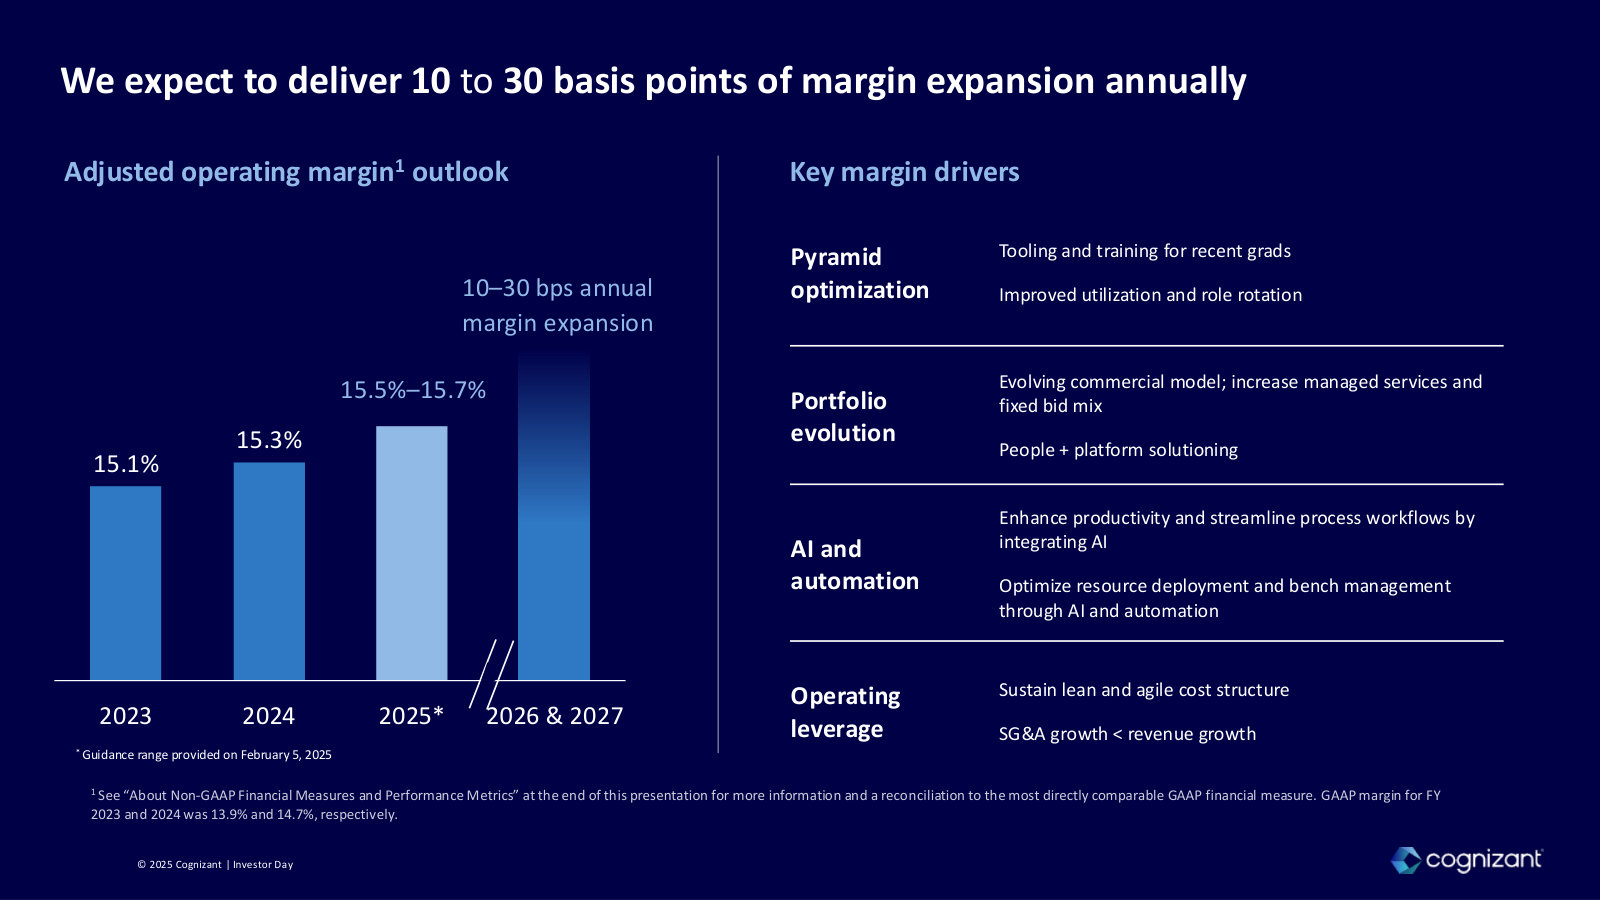
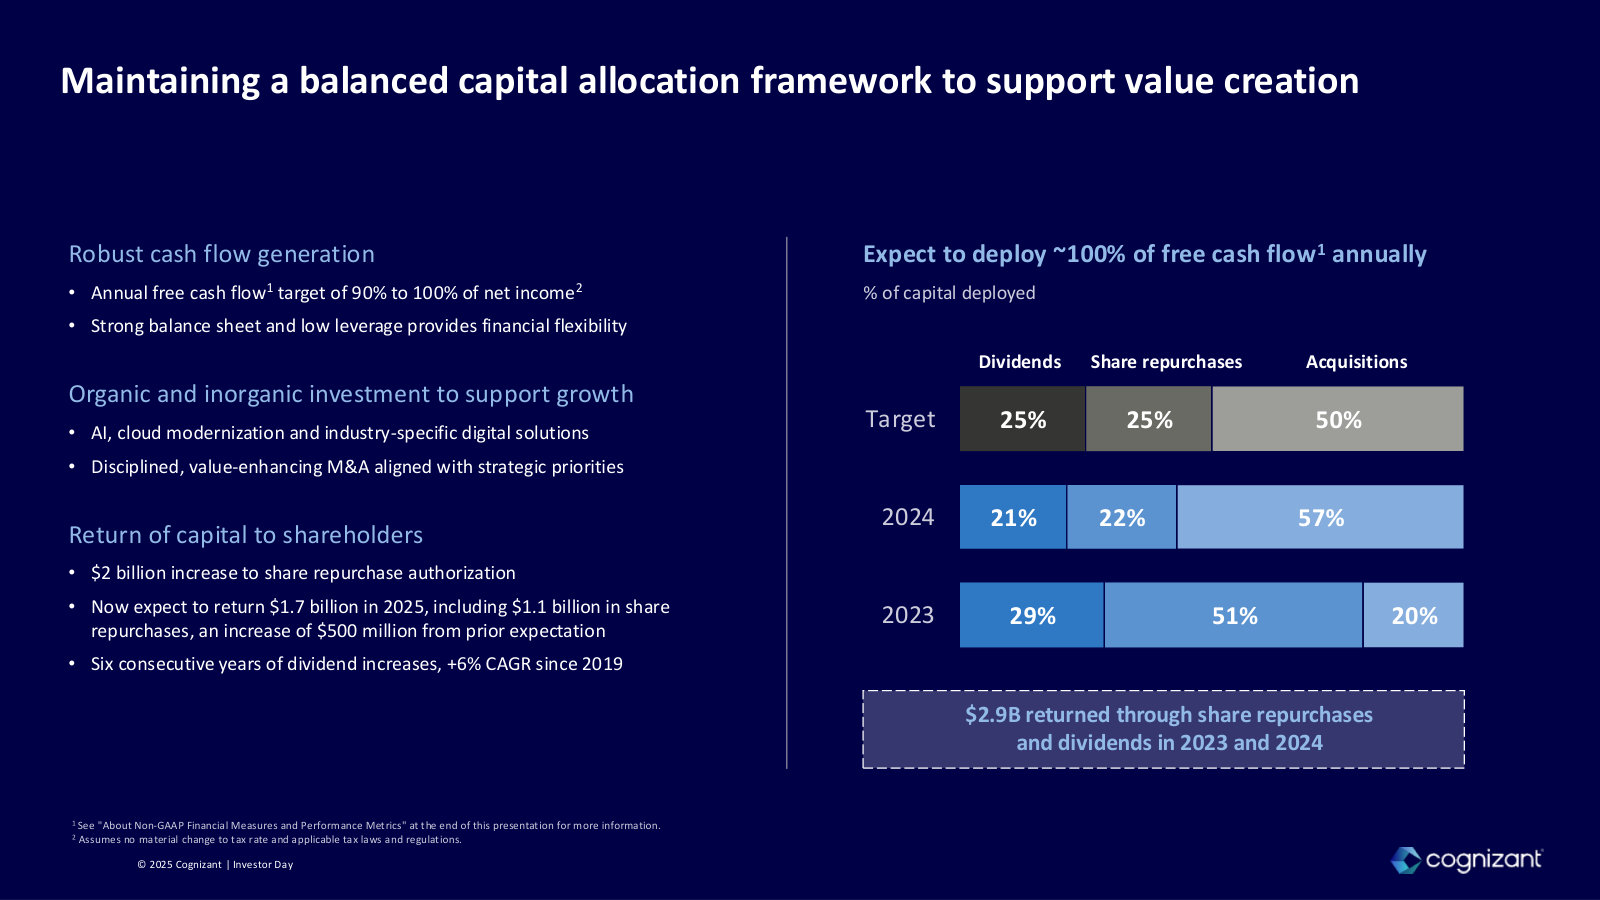
p. 6 — The company's arc across four tech waves — from 1990s app development to today's AI push — in one timeline. · Open the full presentation →p. 8 — A scorecard against the 2023-24 turnaround plan: attrition down 10 pts, large-deal TCV +50%, revenue growth +900 bps. · Open the full presentation →p. 13 — How management sizes its opportunity: the four markets it plays in, their 2027 TAM and growth rates. · Open the full presentation →p. 14 — The revenue base by industry (Health 30%, Financial 29%, CMT 17%, Products 24%) and the acquisitions built into each. · Open the full presentation →p. 15 — The three-vector AI framework — hyperproductivity now, industrializing AI, agentifying the enterprise — that organizes the strategy. · Open the full presentation →p. 17 — Vector 1 in numbers: ~230k staff trained on AI, 12k FTE releases, ~20% of code machine-assisted. · Open the full presentation →p. 19 — Vector 2's platform portfolio — the Neuro suite and other IP grouped by technology, industry and operations. · Open the full presentation →p. 23 — Vector 3 quantified: the leap from IT budgets to far larger labor-pool spend, with early efficiency gains by industry. · Open the full presentation →p. 24 — Why management thinks it can win in AI: early investment, a platform approach, and tech-domain-operations reach. · Open the full presentation →p. 27 — The core recovery story — revenue-growth rank versus 10 named peers, from 10th in 2022 toward top-tier by 2027. · Open the full presentation →p. 28 — The financial targets management is now measured against: top-tier growth, 10-30 bps annual margin gains, 90-100% FCF conversion. · Open the full presentation →p. 32 — How the platforms map to client IT estates — modernize, optimize and innovate — with the product names under each. · Open the full presentation →p. 34 — Proof the platforms land: client cost and productivity gains, and 400+ platform instances deployed. · Open the full presentation →p. 36 — The engineering business split by revenue: ~$6B+ software engineering and ~$2B+ engineering & IoT. · Open the full presentation →p. 37 — The delivery model — three-shore, 45 countries, 80k offshore staff — plus the acquisitions and partners behind it. · Open the full presentation →p. 42 — The engineering & IoT market sized at ~$280B, broken down by horizontal and by industry. · Open the full presentation →p. 49 — Data and cloud — ~40% of revenue — against an ~$840B market, with the platforms and analyst recognition behind it. · Open the full presentation →p. 50 — The AI technology stack, with data and cloud as the foundation layer beneath the three vectors. · Open the full presentation →p. 60 — The scale of the AI investment: innovation studios across seven cities, 57 patents, 70+ publications. · Open the full presentation →p. 61 — A plain explainer of multi-agent AI — how gen-AI models, single agents and multi-agent systems differ. · Open the full presentation →p. 68 — The Americas (75% of revenue): $14.7B, 200k+ associates, and the industry split with client-penetration stats. · Open the full presentation →p. 72 — TriZetto, the healthcare platform moat — ~$1B revenue, 65% of the US-insured population — and where it expands next. · Open the full presentation →p. 73 — How growth is being won: rising large- and mega-deal counts and the global-capability-center (GCC) opportunity. · Open the full presentation →p. 77 — The EMEA market (~$400B, 6% CAGR) by region, and the trends drawing first-time outsourcers. · Open the full presentation →p. 84 — The alliance ecosystem in one slide — the hyperscaler and software partners Cognizant sells with. · Open the full presentation →p. 90 — The workforce story: 275k upskilled, 136k promoted, and the employer-brand awards behind retention. · Open the full presentation →p. 98 — The order book: bookings $24.1B to $27.1B, $100M+ deals 17 to 29, book-to-bill up to 1.4x. · Open the full presentation →p. 99 — The revenue turn in numbers — constant-currency growth improving ~900 bps to +6.7% by Q4'24. · Open the full presentation →p. 100 — The margin turn — adjusted operating margin rising 14.6% to 15.7% via the NextGen cost program. · Open the full presentation →p. 101 — The whole-company view: FY24 revenue by segment, each mapped to its addressable-market growth rate. · Open the full presentation →p. 102 — The M&A program by area — ~$1.8B/$1.4B/$0.7B/$0.9B deployed since 2020 — and the brands acquired. · Open the full presentation →p. 104 — The forward margin plan: 10-30 bps of annual expansion and the levers behind it. · Open the full presentation →p. 105 — The capital-allocation framework — target 25% dividends / 25% buybacks / 50% M&A — and what was actually returned. · Open the full presentation →
The latest full-year results and guidance, plus the scorecard that closes the loop on the March 2025 Investor Day targets. · Open the full document →
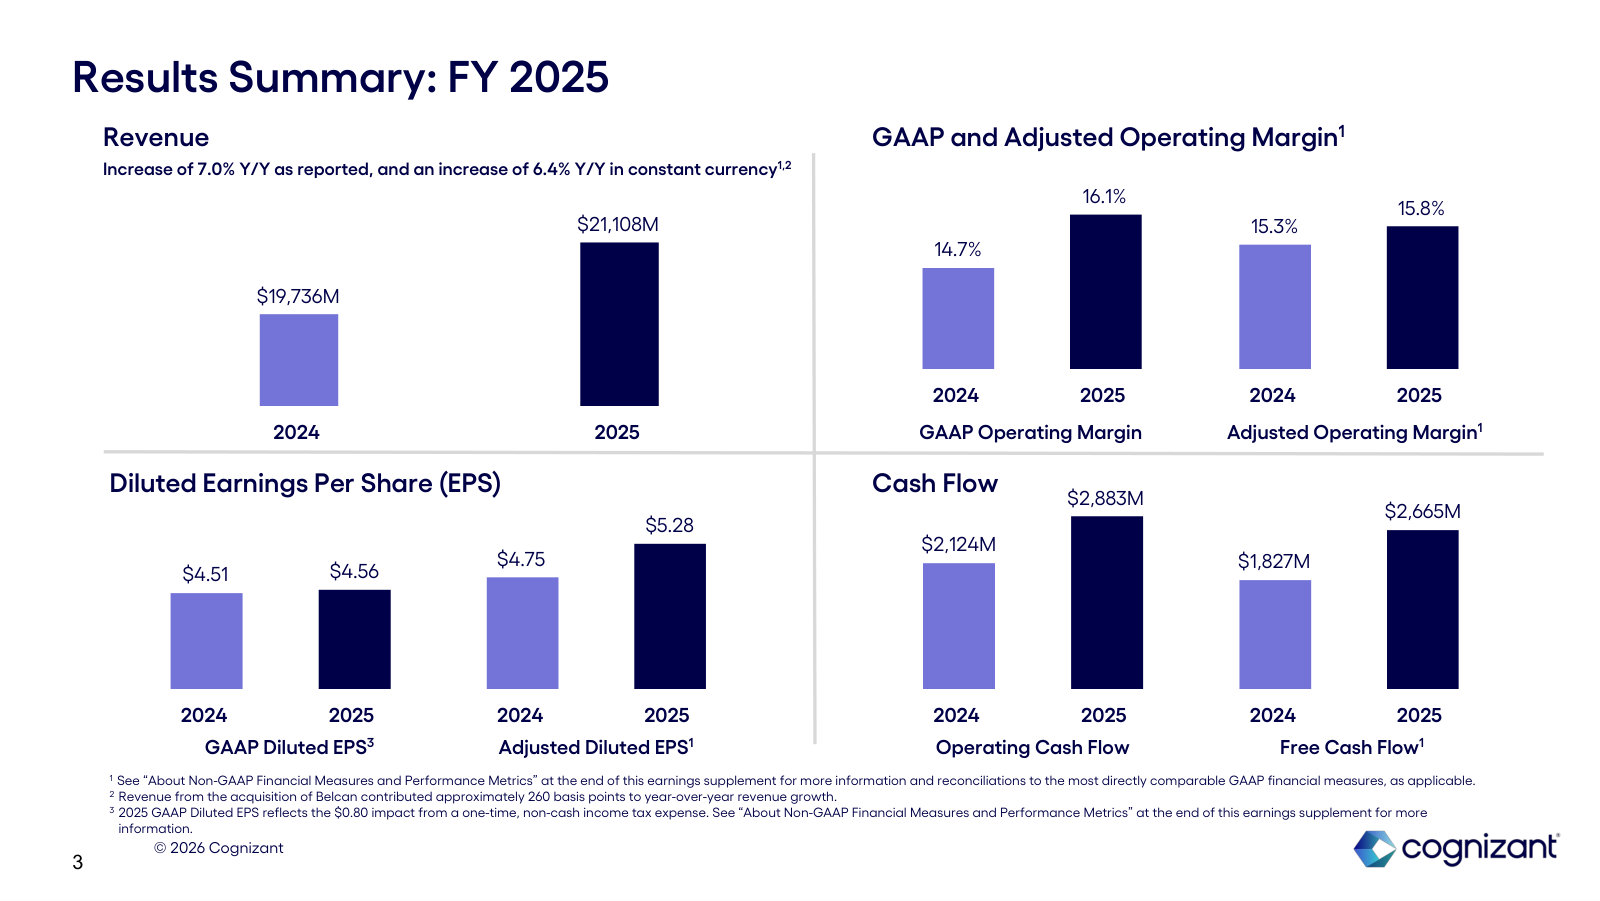
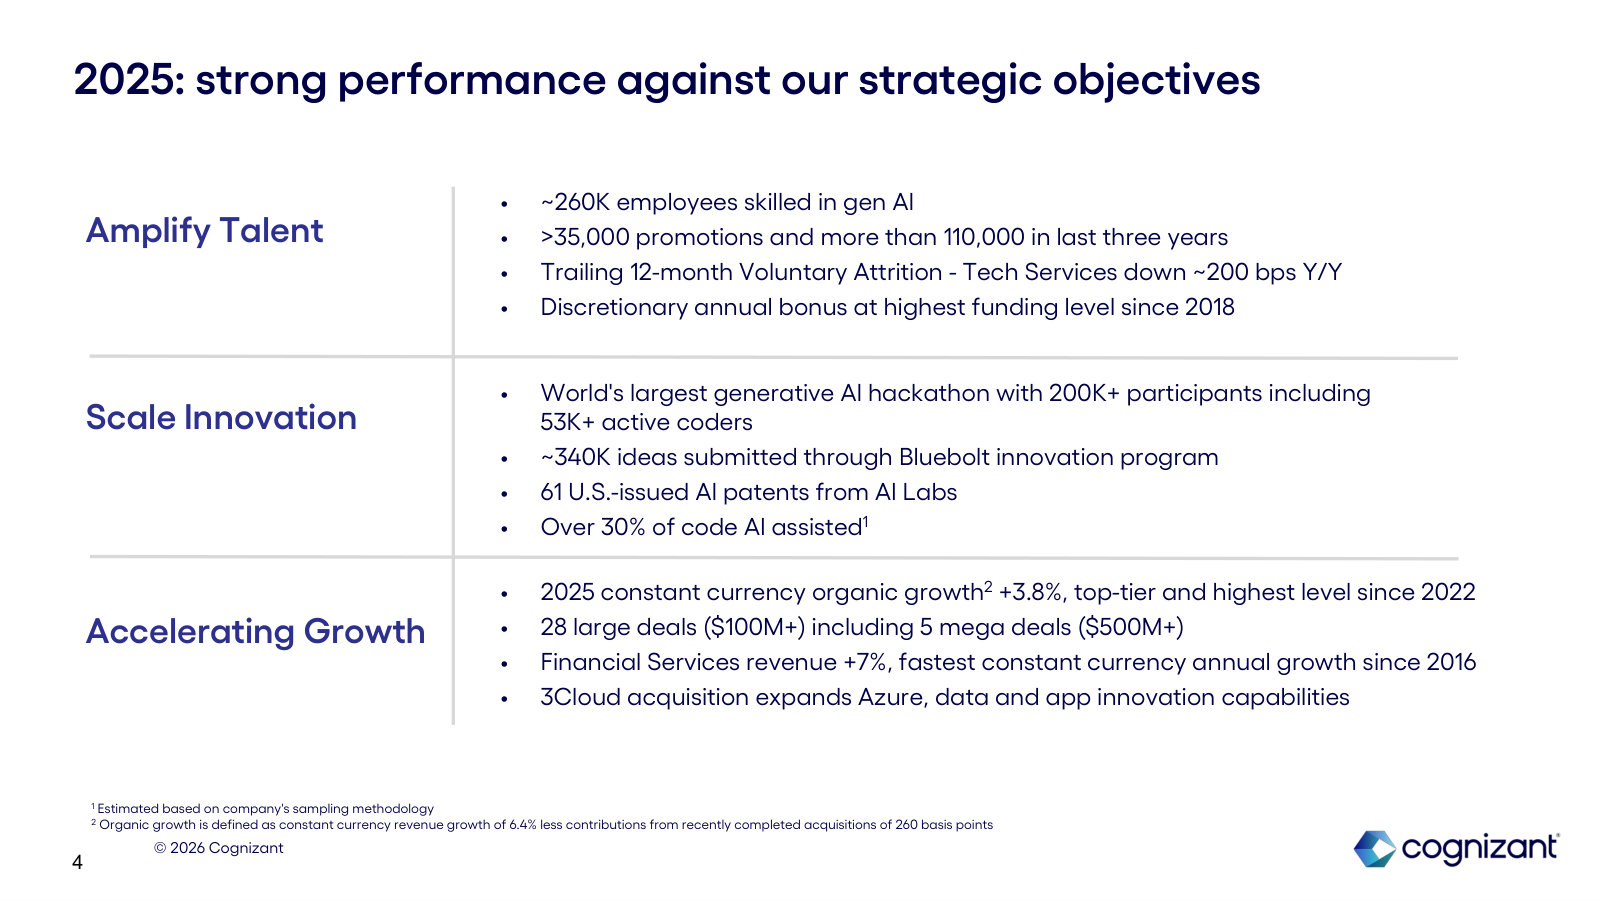
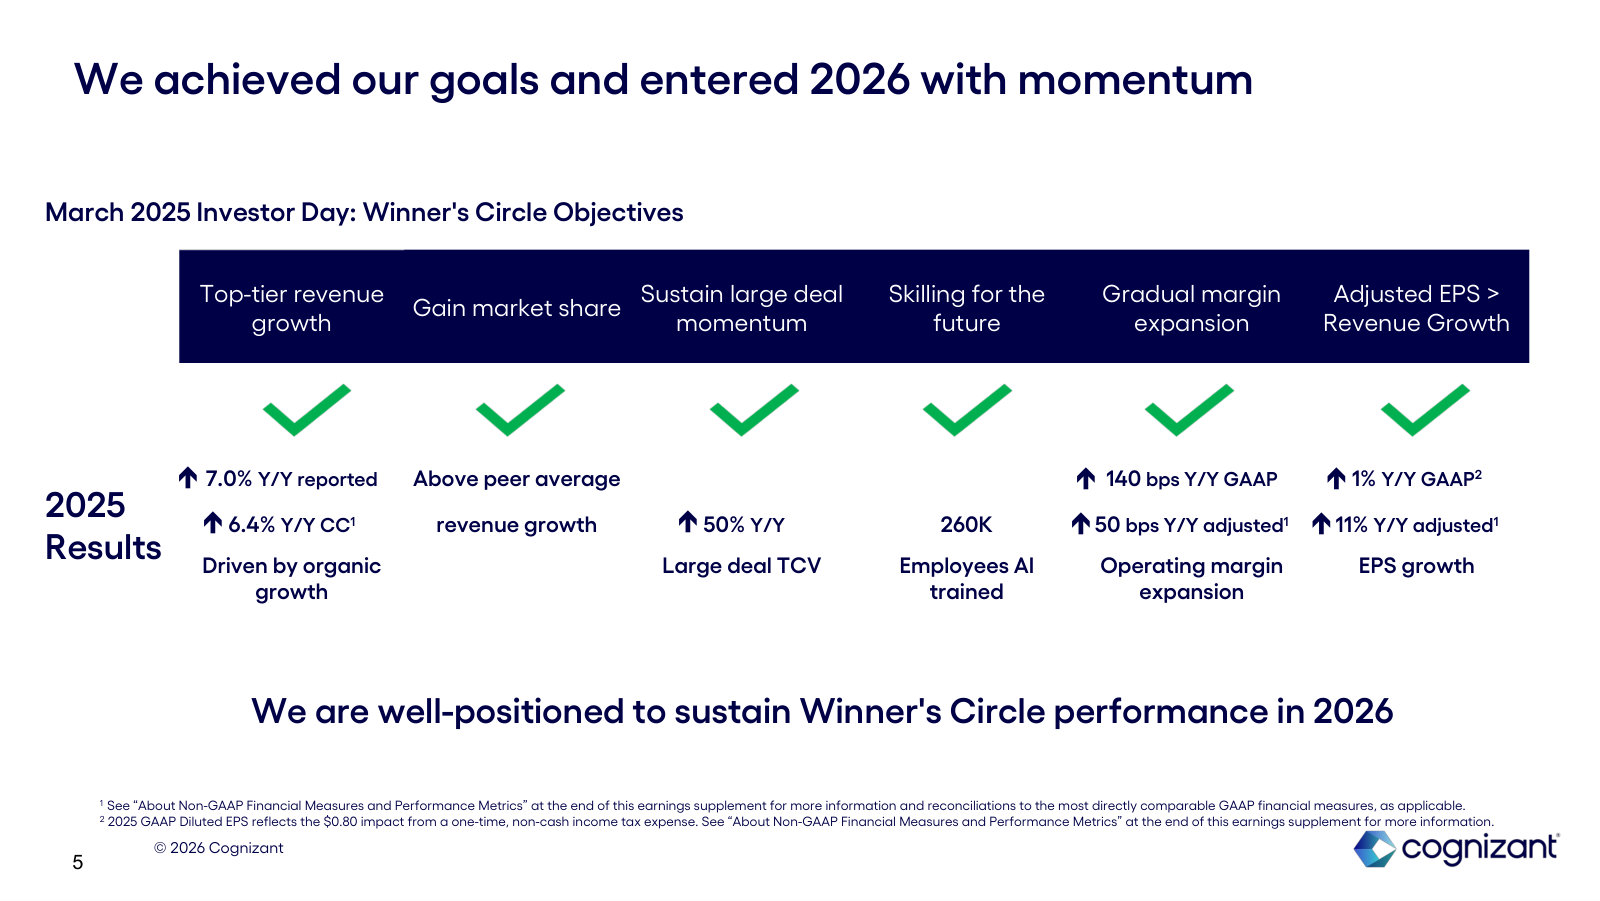
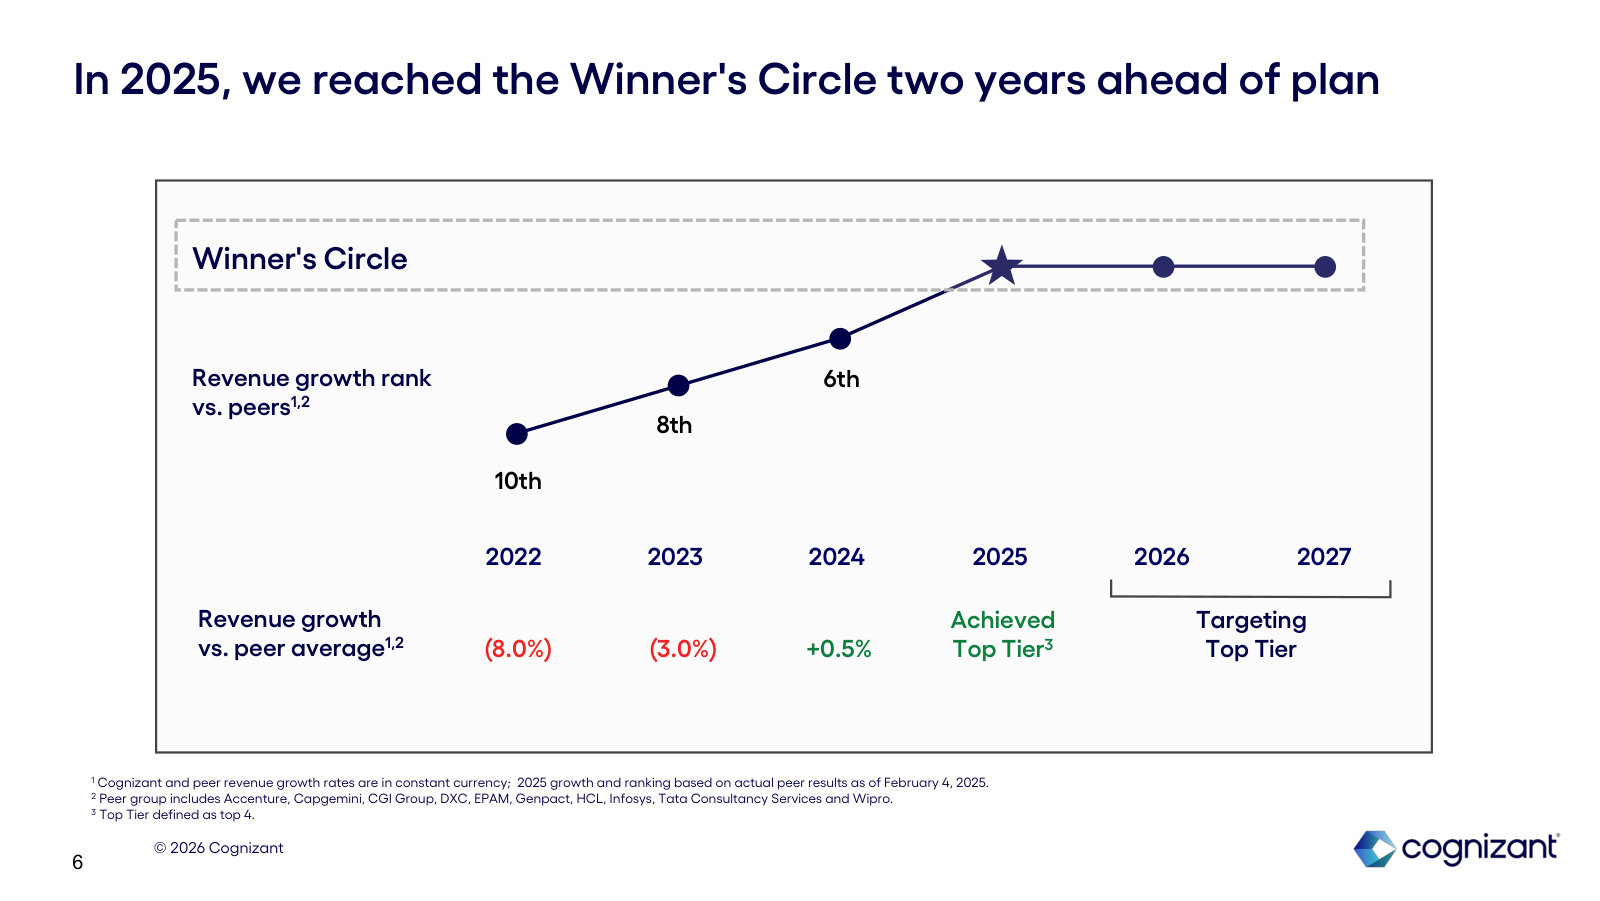
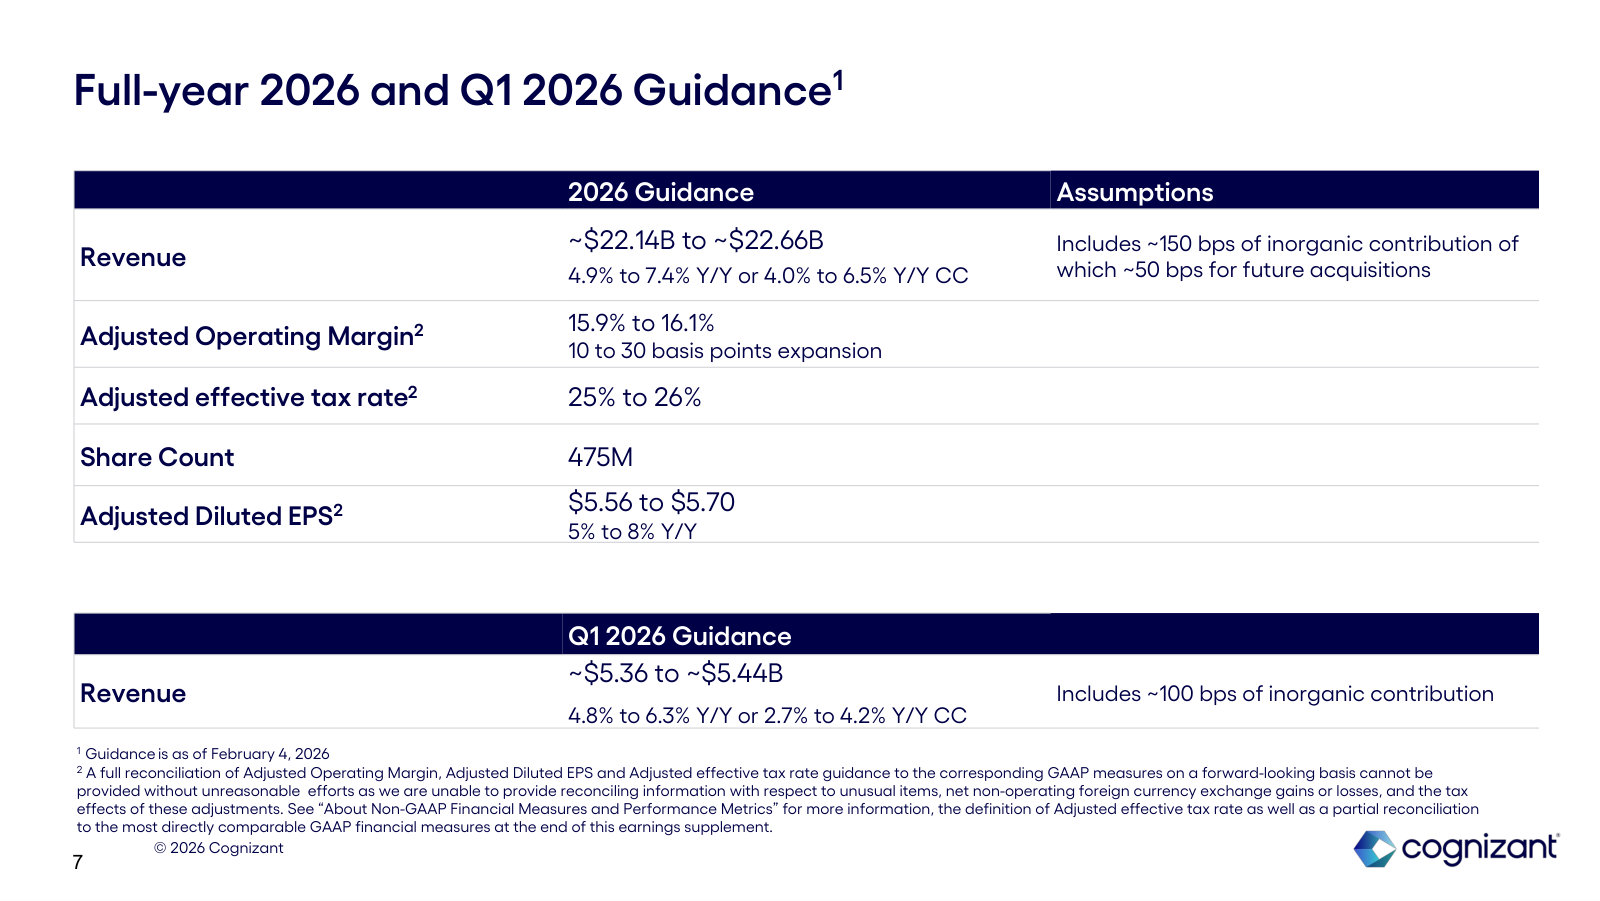
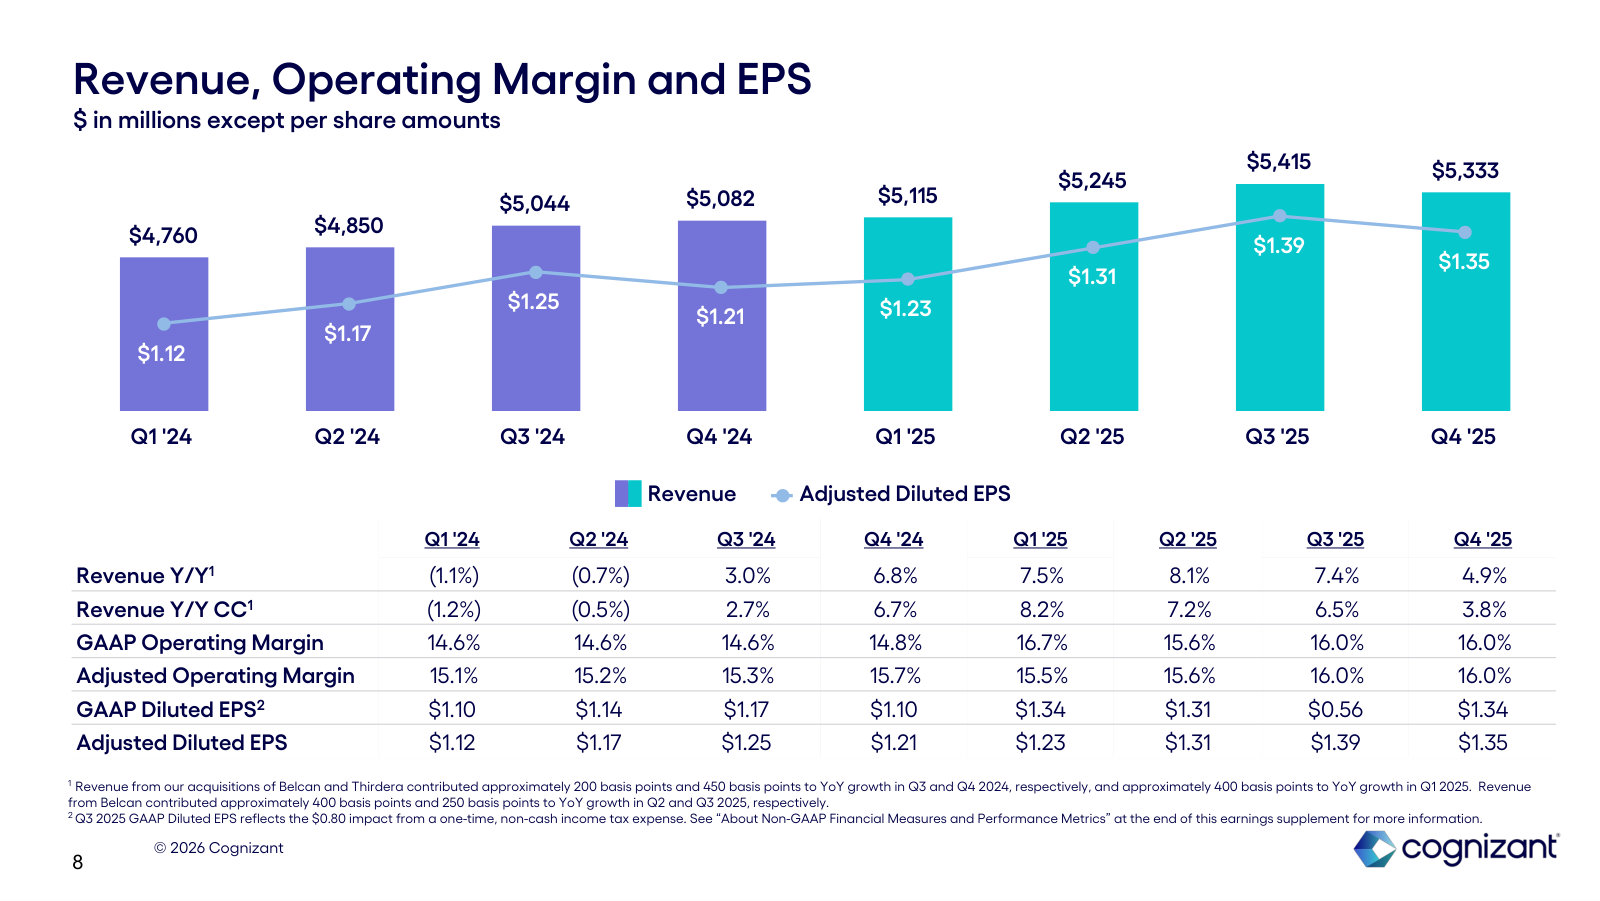
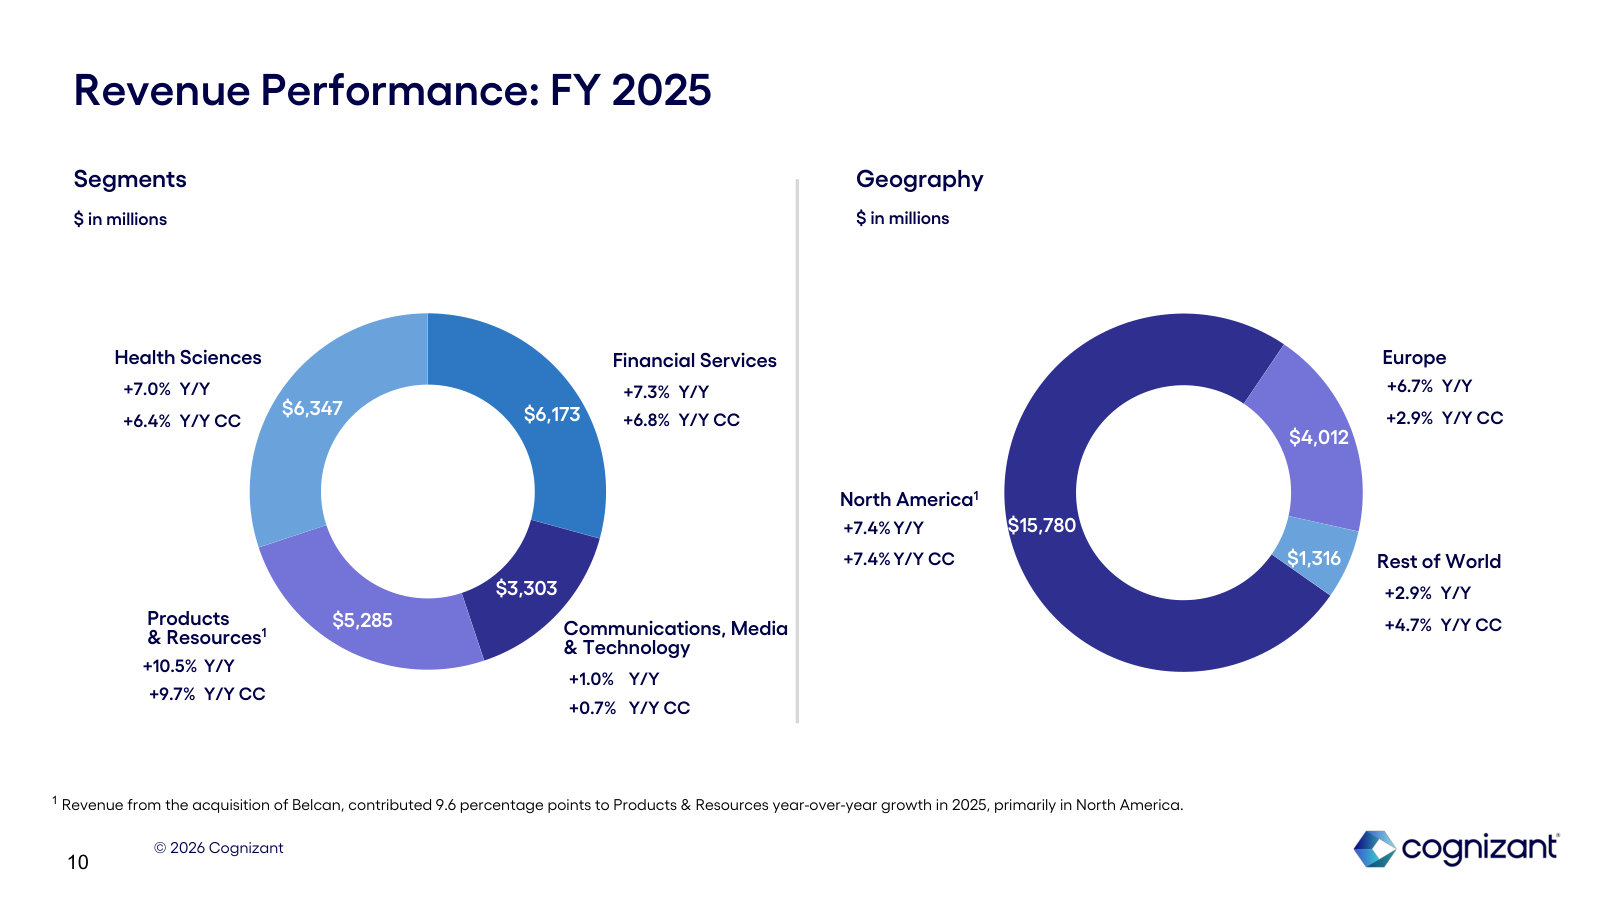
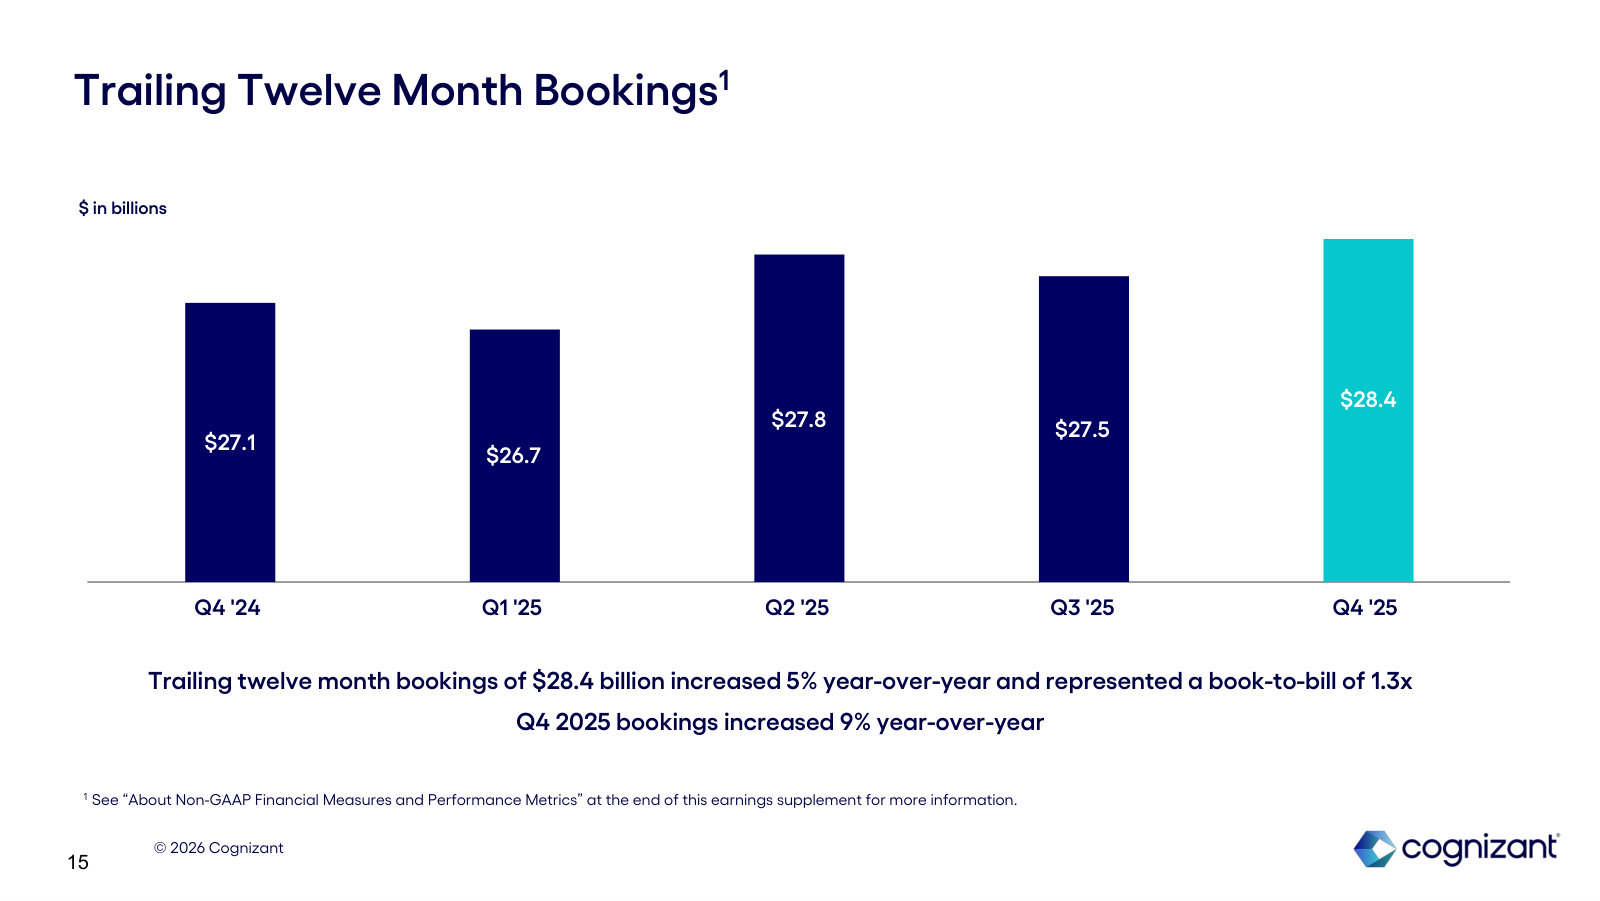
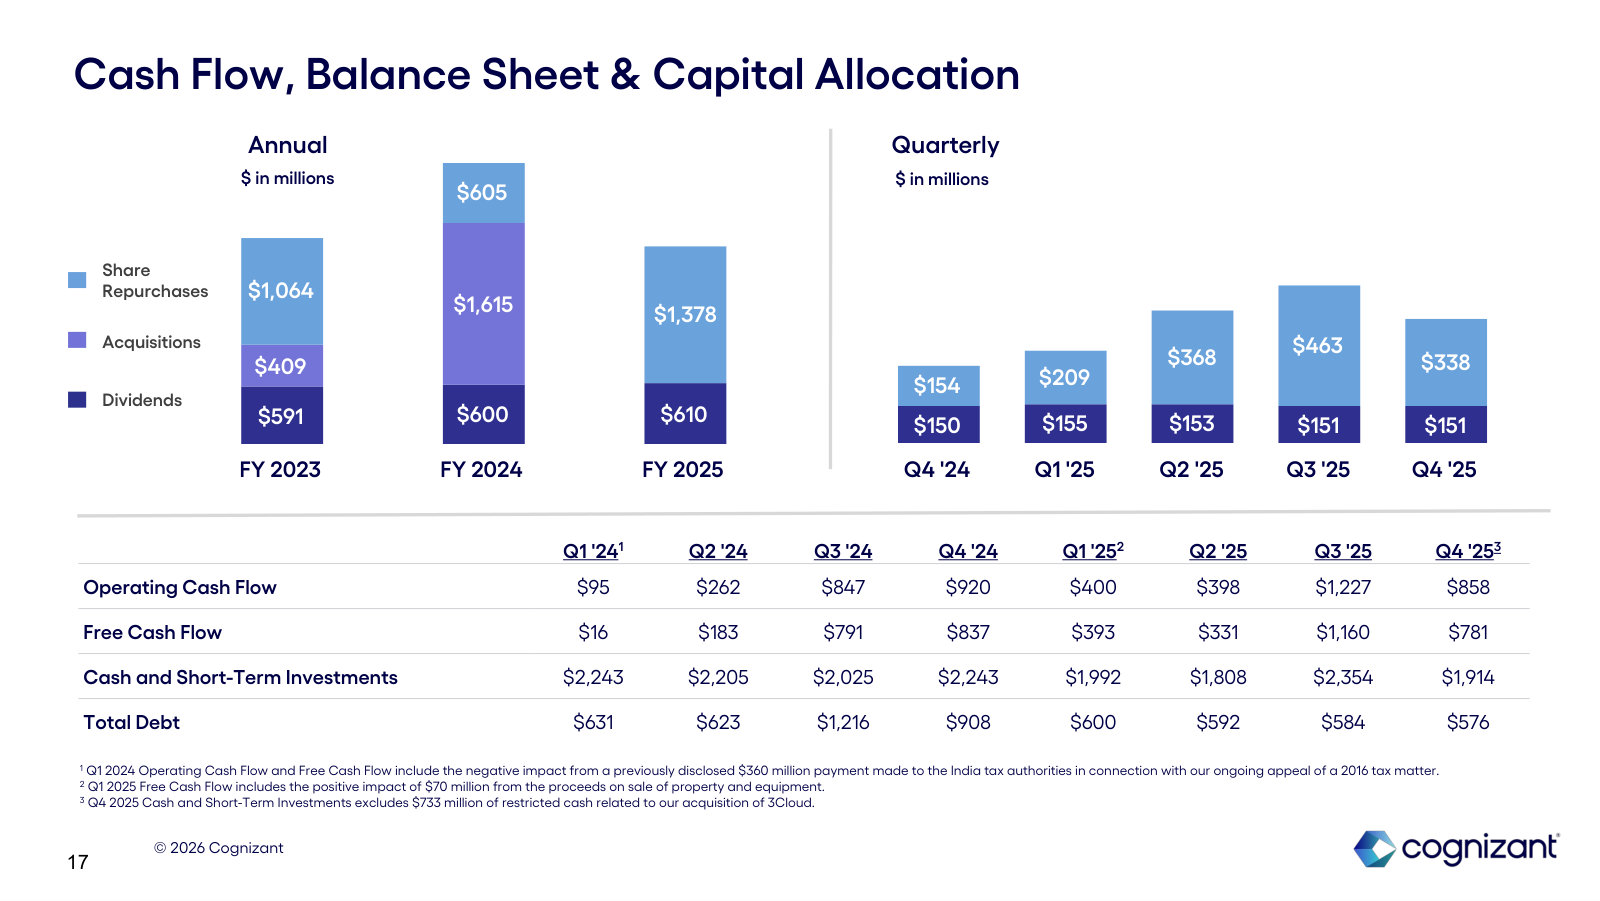
p. 4 — The full-year 2025 scorecard: revenue $21.1B (+7%), adjusted margin 15.8%, adjusted EPS $5.28, free cash flow $2.7B. · Open the full presentation →p. 5 — What 2025 delivered against the three strategic objectives — talent, innovation and growth — in specifics. · Open the full presentation →p. 6 — The Investor Day targets checked off against 2025 actuals — the clearest read on whether the plan is working. · Open the full presentation →p. 7 — The payoff: revenue-growth rank reached top-tier ('Winner's Circle') in 2025, two years ahead of the 2027 plan. · Open the full presentation →p. 8 — The forward guide: 2026 revenue ~$22.1-22.7B and adjusted diluted EPS $5.56-5.70. · Open the full presentation →p. 9 — Eight quarters of revenue and adjusted EPS in one chart — the trajectory into 2026. · Open the full presentation →p. 11 — Where FY2025 revenue came from — segment and geography mix, with growth rates for each. · Open the full presentation →p. 16 — Trailing-twelve-month bookings of $28.4B and a 1.3x book-to-bill — the pipeline behind future revenue. · Open the full presentation →p. 18 — Cash generation and how it's returned — dividends, buybacks and acquisitions by year. · Open the full presentation →
Q1 2026 Earnings Presentation — Q1 2026 · 19 pages · The latest quarterly numbers and updated 2026 guidance, in the same earnings-supplement format. · Open →
Q4 & Full-Year 2024 Earnings Presentation — Q4 / FY2024 · 20 pages · The full-year 2024 baseline — the pre-Winner's-Circle starting point the recovery is measured from. · Open →