Full Report
The numbers behind Cognizant Technology Solutions Corporation: as-reported financial statements and company metrics for FY2021–FY2025, traced to the source filings, opened with the share-price history those statements have to justify. Every linked figure opens the exact page of the filing it was printed on, with the statement row highlighted. Amounts in US$ millions unless noted.
Reading notes: Display unit is US$ millions, as printed on Cognizant's consolidated statements ('in millions, except per share data'). Main columns FY2021–FY2025 are cited to each year's own Form 10-K current-year column (income statement and cash flow print three years; the balance sheet prints two). Revenue by industry segment: FY2024 and FY2025 use the Note 17 segment table in the FY2025 10-K (new ASU 2023-07 format); FY2022 and FY2023 use the comparable Note 18 table in the FY2024 10-K; FY2021 uses the Revenue Recognition disaggregation table (per-segment totals) in the FY2023 10-K, because pre-FY2024 segment footnotes present the revenue table as an image not machine-readable in the corpus. Segment operating profit is shown only for FY2024–FY2025. The company changed its internal segment-profit measurement in Q1 2025 and recast FY2024 but states FY2023 is impracticable to recast; earlier years used yet other methodologies, so a longer comparable series is not available.
Share Price — Full Available History — 28 Years
The stock closed at $44.07 on Jul 17, 2026 — up 1,015,289% over the window shown (+38.9% a year), trading between $0.00 and $93.12. At that close the stock trades at 9.7× FY2025 diluted EPS as reported below.
Source: market price feed, monthly closes, sampled from 7,062 source observations, Jun 1998–Jul 2026. Price return only, excludes dividends. Prices are split-adjusted (1:2 on Mar 17, 2000; 1:3 on Apr 02, 2003; 1:2 on Jun 18, 2004; 1:2 on Oct 17, 2007; 1:2 on Mar 10, 2014).
FY2025 at a Glance
Revenue (US$ millions)
Net income (US$ millions)
Diluted EPS
Source: FY2025 consolidated statements [1] [2] [3] [4]. Click any linked figure to open the filing page with the row highlighted.
Revenue by Industry Segment
| Revenue by Industry Segment | FY2021 | FY2022 | FY2023 | FY2024 | FY2025 |
|---|---|---|---|---|---|
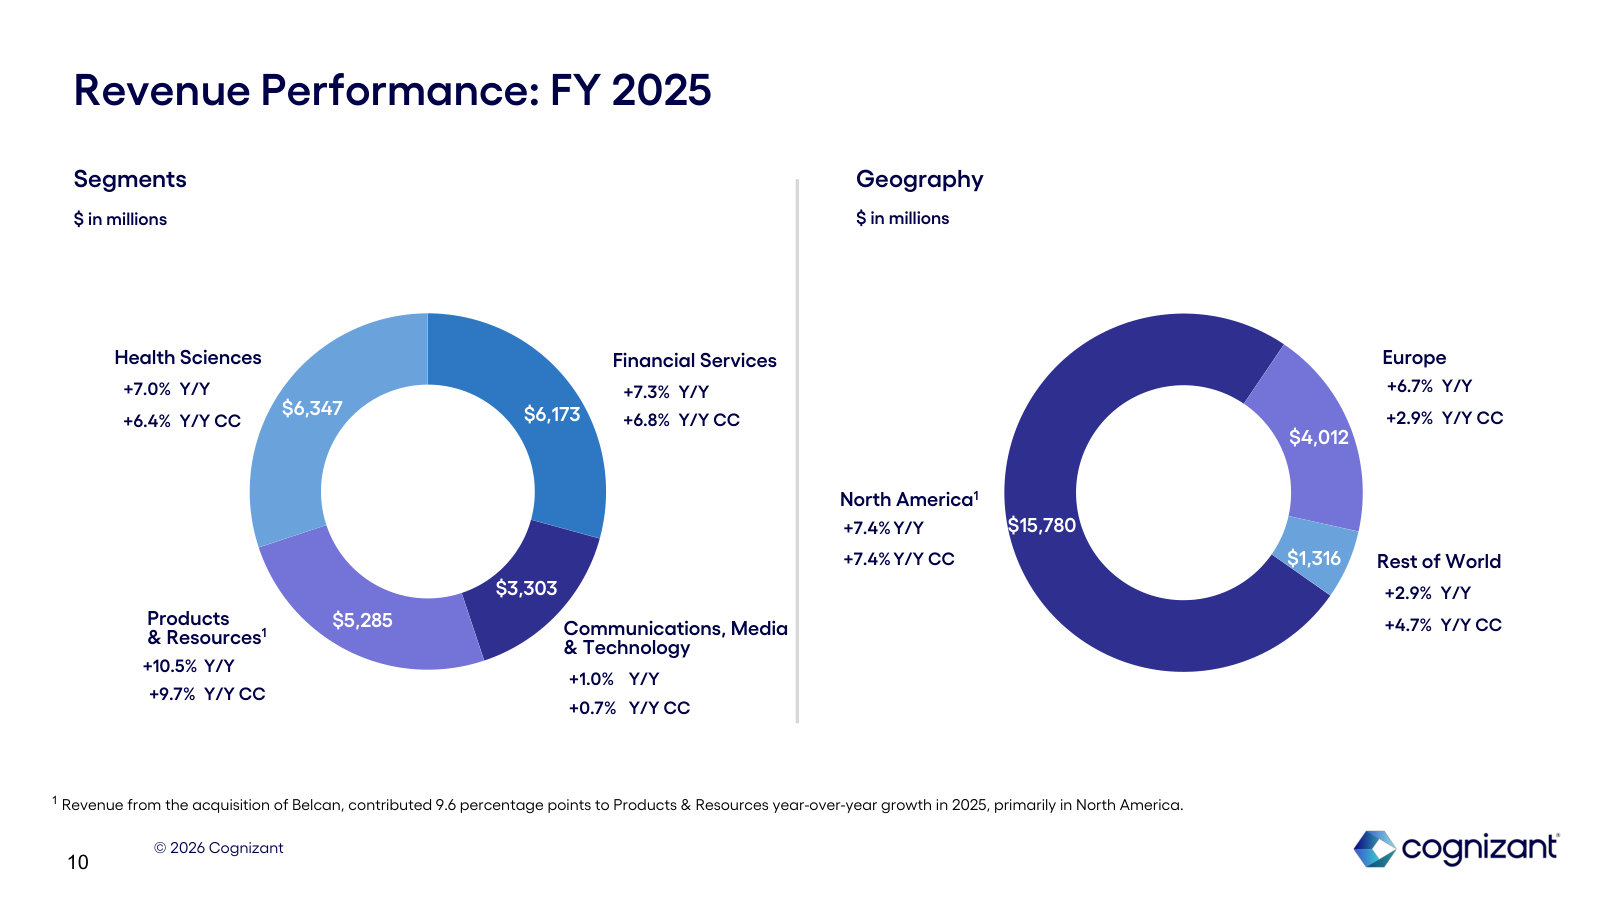
| Health Sciences | 5,337 | 5,631 | 5,674 | 5,932 | 6,347 |
| Financial Services | 6,051 | 6,072 | 5,809 | 5,753 | 6,173 |
| Products and Resources | 4,276 | 4,566 | 4,628 | 4,782 | 5,285 |
| Communications, Media and Technology | 2,843 | 3,159 | 3,242 | 3,269 | 3,303 |
| Total revenues | 18,507 | 19,428 | 19,353 | 19,736 | 21,108 |
| Total revenues growth, derived | — | +5.0% | -0.4% | +2.0% | +7.0% |
Source: Segment Information footnote (reportable business segments); FY2021 from the Revenue Recognition disaggregation table [5] [6] [7] [8]. Click any linked figure to open the filing page with the row highlighted.
Segment Operating Profit
| Segment Operating Profit | FY2021 | FY2022 | FY2023 | FY2024 | FY2025 |
|---|---|---|---|---|---|
| Health Sciences | — | — | — | 1,073 | 1,233 |
| Financial Services | — | — | — | 915 | 1,029 |
| Products and Resources | — | — | — | 771 | 787 |
| Communications, Media and Technology | — | — | — | 393 | 436 |
| Total segment operating profit | — | — | — | 3,152 | 3,485 |
| Less: unallocated costs | — | — | — | 260 | 96 |
| Income from operations | — | — | — | 2,892 | 3,389 |
Source: Segment Information footnote. Cognizant recast its segment-profit methodology in Q1 2025 (allocating certain corporate costs to segments) and recast FY2024 to conform; it states FY2023 and earlier are impracticable to recast, so only the comparable FY2024–FY2025 pair is shown. [5] [6]. Click any linked figure to open the filing page with the row highlighted.
Income Statement
Source: Consolidated Statements of Operations [1] [2] [3] [4]. Click any linked figure to open the filing page with the row highlighted.
Columns marked E are consensus analyst estimates shown alongside reported results for direct comparison; they are not company guidance.
Estimate source: Yahoo Finance analyst consensus, as of 2026-07-17. Estimate figures link to the consensus source, not to filing pages.
Balance Sheet
Source: Consolidated Statements of Financial Position [9] [10] [11] [12]. Click any linked figure to open the filing page with the row highlighted.
Cash Flow
Source: Consolidated Statements of Cash Flows [13] [14] [15] [16]. Click any linked figure to open the filing page with the row highlighted.
Revenue by Geography
| Revenue by Geography | FY2021 | FY2022 | FY2023 | FY2024 | FY2025 |
|---|---|---|---|---|---|
| North America | 13,636 | 14,435 | 14,263 | 14,698 | 15,780 |
| Europe | 3,561 | 3,605 | 3,794 | 3,759 | 4,012 |
| Rest of World | 1,310 | 1,388 | 1,296 | 1,279 | 1,316 |
| Total revenues | 18,507 | 19,428 | 19,353 | 19,736 | 21,108 |
Source: Revenue Recognition footnote — disaggregation of revenues by geography (client billing location) [17] [18] [8] [19]. Click any linked figure to open the filing page with the row highlighted.
Workforce Global Delivery
| Workforce Global Delivery | FY2021 | FY2022 | FY2023 | FY2024 | FY2025 |
|---|---|---|---|---|---|
| Total employees (year-end, approx.) | 330,600 | 355,300 | 347,700 | 336,800 | 351,600 |
| Employees based in India (approx.) | 240,000 | 258,500 | 254,000 | 241,500 | 256,900 |
| Voluntary Attrition – Tech Services | — | 25.6% | 13.8% | 15.9% | 13.9% |
| Women as % of workforce | 38.0% | 38.0% | 38.0% | 38.0% | 39.0% |
Source: company filings [20] [21] [22] [23]. Click any linked figure to open the filing page with the row highlighted.
Margins Cash Conversion
| Margins Cash Conversion | FY2021 | FY2022 | FY2023 | FY2024 | FY2025 |
|---|---|---|---|---|---|
| GAAP operating margin | — | — | 13.9% | 14.7% | 16.1% |
| Adjusted operating margin (non-GAAP) | — | — | 15.1% | 15.3% | 15.8% |
| Days Sales Outstanding (DSO) | 69 | 74 | 77 | 78 | 81 |
Source: company filings [24] [25] [26] [27]. Click any linked figure to open the filing page with the row highlighted.
Capital Returns to Shareholders
| Capital Returns to Shareholders | FY2021 | FY2022 | FY2023 | FY2024 | FY2025 |
|---|---|---|---|---|---|
| Dividends declared per share | 0.96 | 1.08 | 1.16 | 1.20 | 1.24 |
| Class A shares repurchased (millions) | 10 | 20 | 15 | 8 | 19 |
| Repurchase authorization remaining | — | — | — | — | 1,918 |
Source: company filings [28] [29] [30]. Click any linked figure to open the filing page with the row highlighted.
Long-Term Record
| Fiscal year | Total revenues | Income from operations | Net income | Diluted earnings per share | Net cash provided by operating activities | Purchases of property and equipment |
|---|---|---|---|---|---|---|
| FY2018 | 16,125 | 2,801 | 2,101 | 3.60 | 2,592 | (377) |
| FY2019 | 16,783 | 2,453 | 1,842 | 3.29 | 2,499 | (392) |
| FY2020 | 16,652 | 2,114 | 1,392 | 2.57 | 3,299 | (398) |
| FY2021 | 18,507 | 2,826 | 2,137 | 4.05 | 2,495 | (279) |
| FY2022 | 19,428 | 2,968 | 2,290 | 4.41 | 2,568 | (332) |
| FY2023 | 19,353 | 2,689 | 2,126 | 4.21 | 2,330 | (317) |
| FY2024 | 19,736 | 2,892 | 2,240 | 4.51 | 2,124 | (297) |
| FY2025 | 21,108 | 3,389 | 2,230 | 4.56 | 2,883 | (288) |
Source: consolidated statements across filings; older years from the standardized feed [13] [1] [14] [2]. Click any linked figure to open the filing page with the row highlighted.
Operating KPIs
| KPI | FY2021 | FY2022 | FY2023 | FY2024 | FY2025 |
|---|---|---|---|---|---|
| Employees (period end) | 330,600 | 355,300 | 347,700 | 336,800 | 351,600 |
| Remaining performance obligations | 1,586 | 3,361 | 4,007 | 4,911 | 6,279 |
Source: company-reported operating metrics [31] [21] [32] [22]. Click any linked figure to open the filing page with the row highlighted.
Analyst Consensus
Current price
Mean target
Median target
High target
Low target
Estimate source: Yahoo Finance analyst consensus, as of 2026-07-17. Estimate figures link to the consensus source, not to filing pages.
Traceability
383 of 392 figures on this page (98%) link to the filing page where they are printed — click a linked figure to open the source PDF at that page with the row highlighted. Unlinked figures come from standardized data feeds or pre-filing years.
Display unit is US$ millions, as printed on Cognizant's consolidated statements ('in millions, except per share data').
Main columns FY2021–FY2025 are cited to each year's own Form 10-K current-year column (income statement and cash flow print three years; the balance sheet prints two).
Revenue by industry segment: FY2024 and FY2025 use the Note 17 segment table in the FY2025 10-K (new ASU 2023-07 format); FY2022 and FY2023 use the comparable Note 18 table in the FY2024 10-K; FY2021 uses the Revenue Recognition disaggregation table (per-segment totals) in the FY2023 10-K, because pre-FY2024 segment footnotes present the revenue table as an image not machine-readable in the corpus.
Segment operating profit is shown only for FY2024–FY2025. The company changed its internal segment-profit measurement in Q1 2025 and recast FY2024 but states FY2023 is impracticable to recast; earlier years used yet other methodologies, so a longer comparable series is not available.
Long-Term Record: FY2019–FY2020 are cited to the FY2021 10-K comparative columns; FY2018 is from the standardized SEC XBRL data feed and shown without a page link. FY2016–FY2017 revenue is not available in the feed, so the Long-Term Record starts at FY2018.
Quarterly Q4 FY25 income and all single-quarter cash flows are derived from printed year-to-date statements (FY2025 10-K full year minus Q3 FY2025 nine-month year-to-date, or successive 10-Q year-to-date differences); every derived value reconciles exactly and was cross-checked against the standardized quarterly data feed.
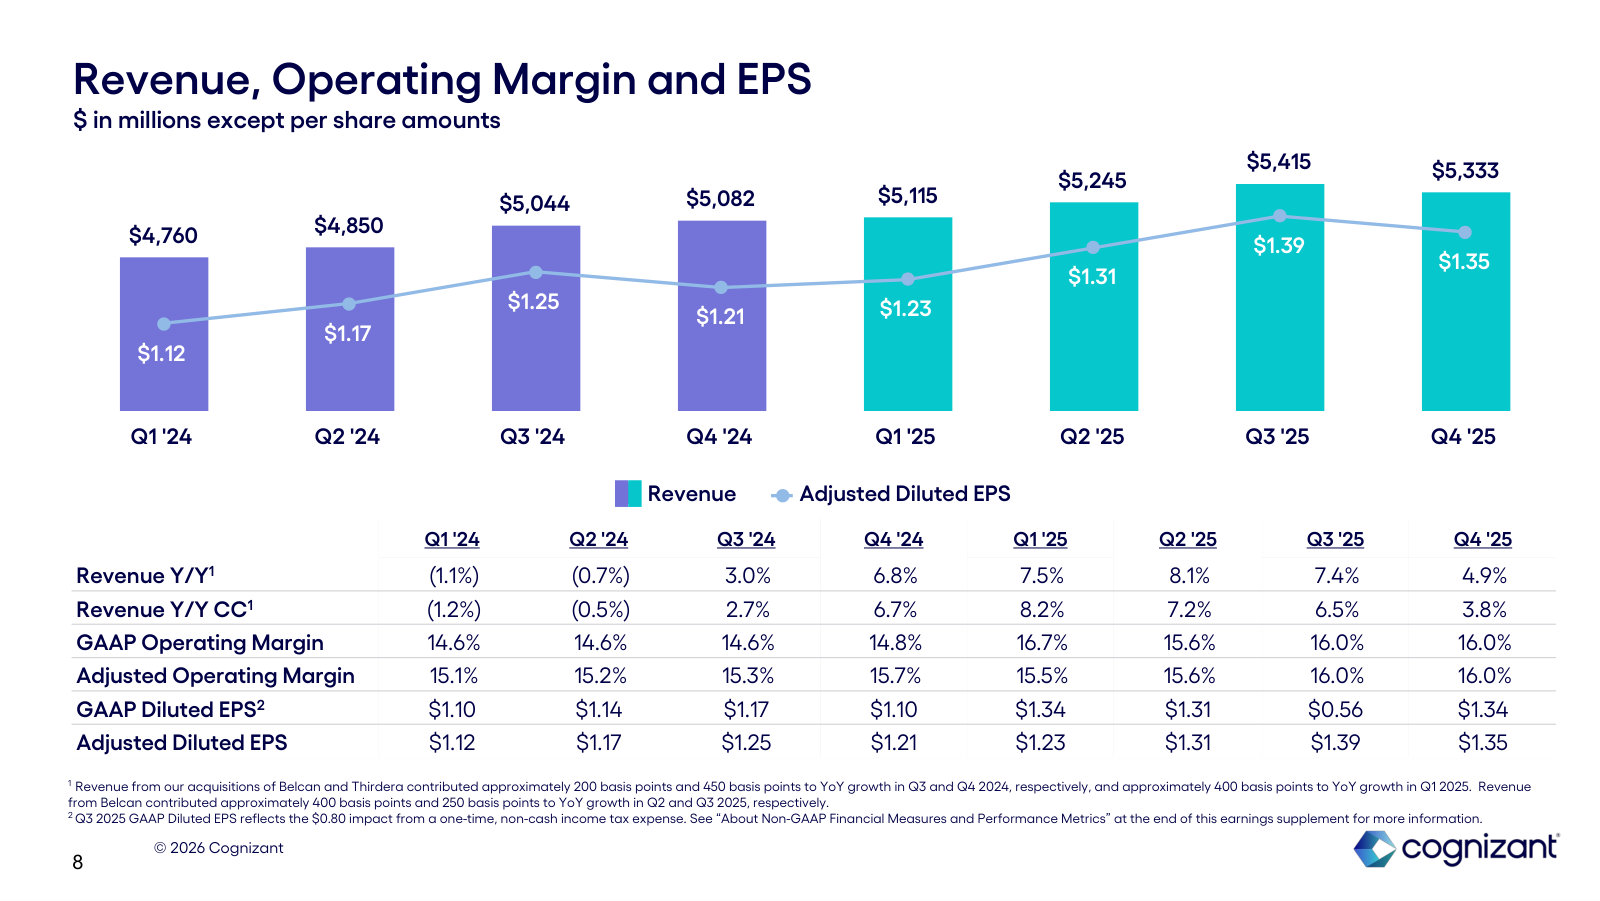
The Q3 FY2025 tax provision ($613 million for the quarter) was elevated by a discrete item, depressing Q3 FY25 net income and diluted EPS relative to the operating trend.
The FY2025 10-K reports the January 1, 2026 acquisition of 3Cloud as a subsequent event; $733 million of cash consideration sat in escrow (restricted cash in Other noncurrent assets) at December 31, 2025, and the Q1 FY2026 10-Q reflects the closed acquisition (goodwill rose to $7,681 million).
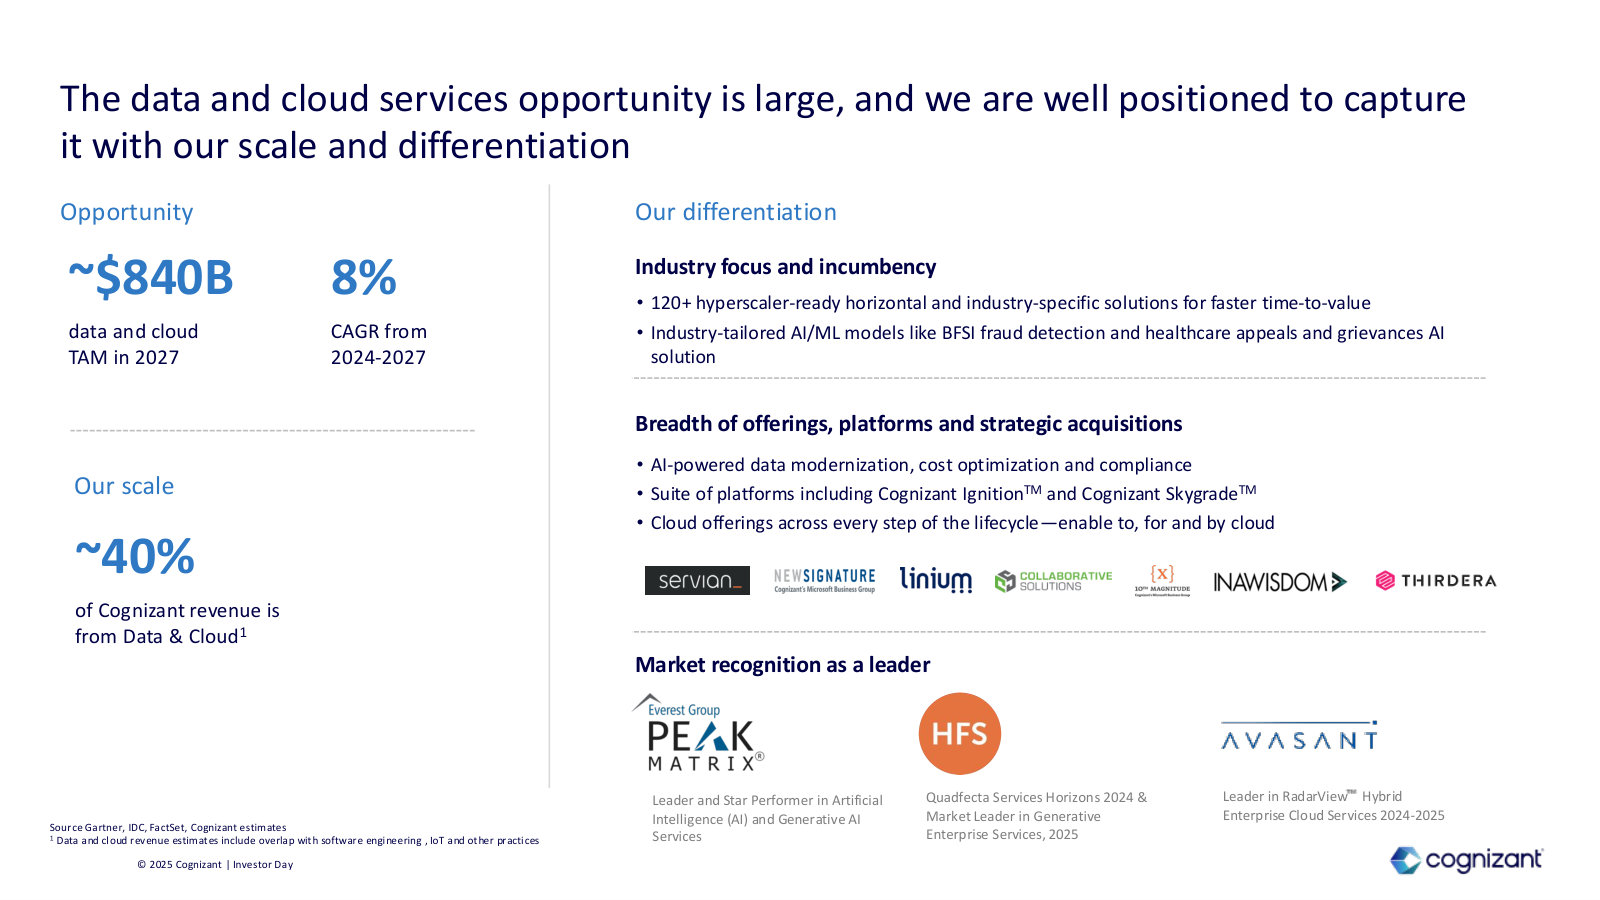
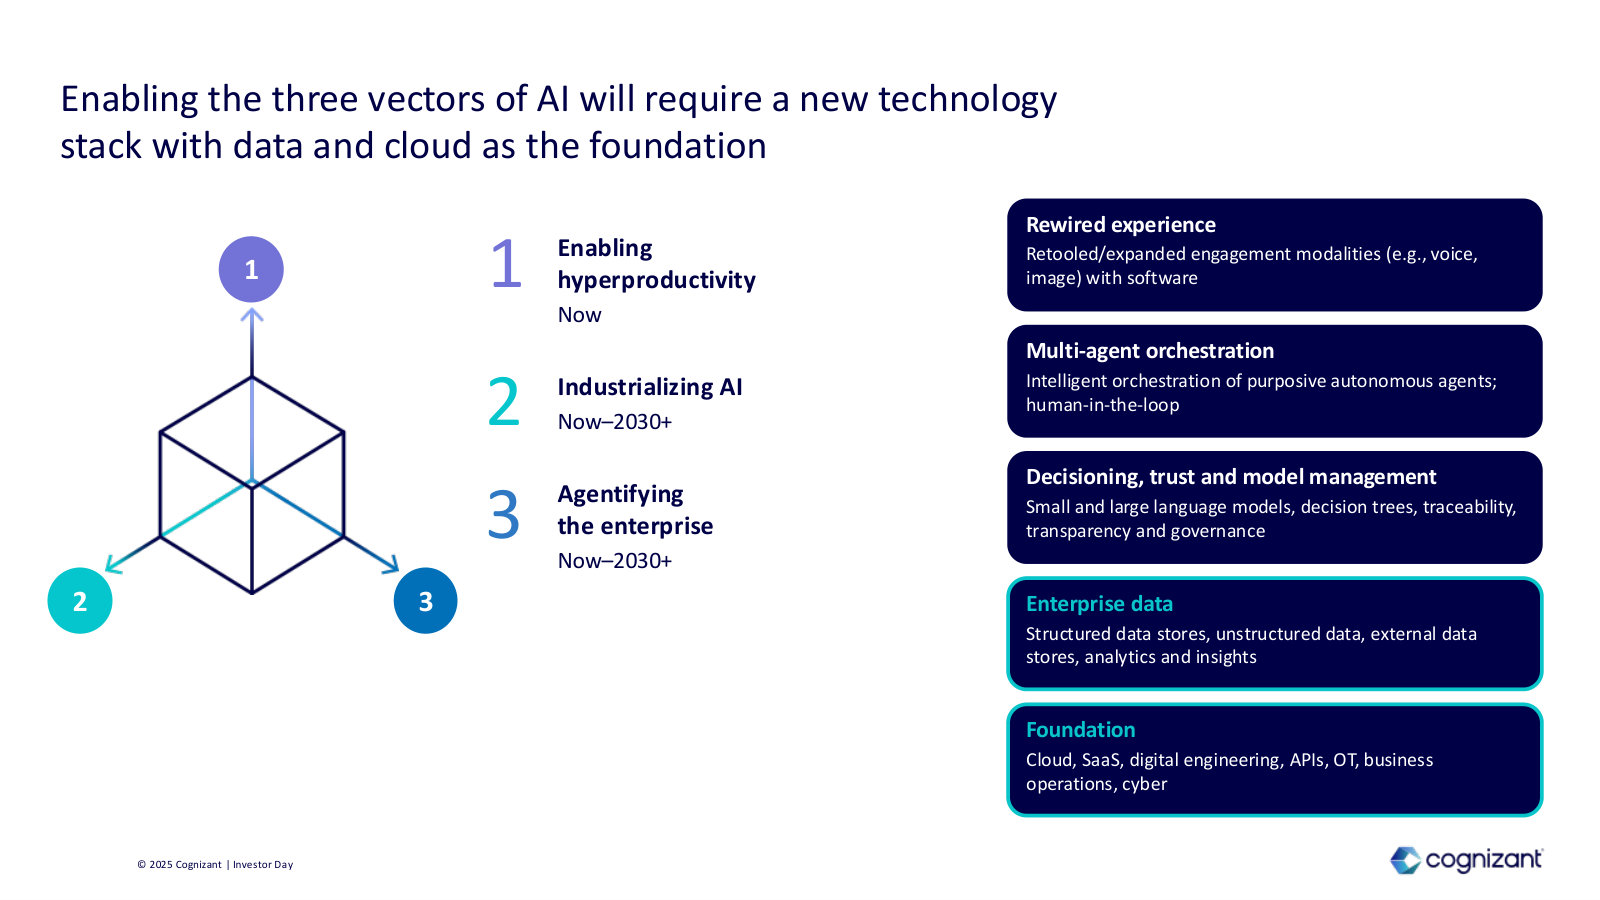
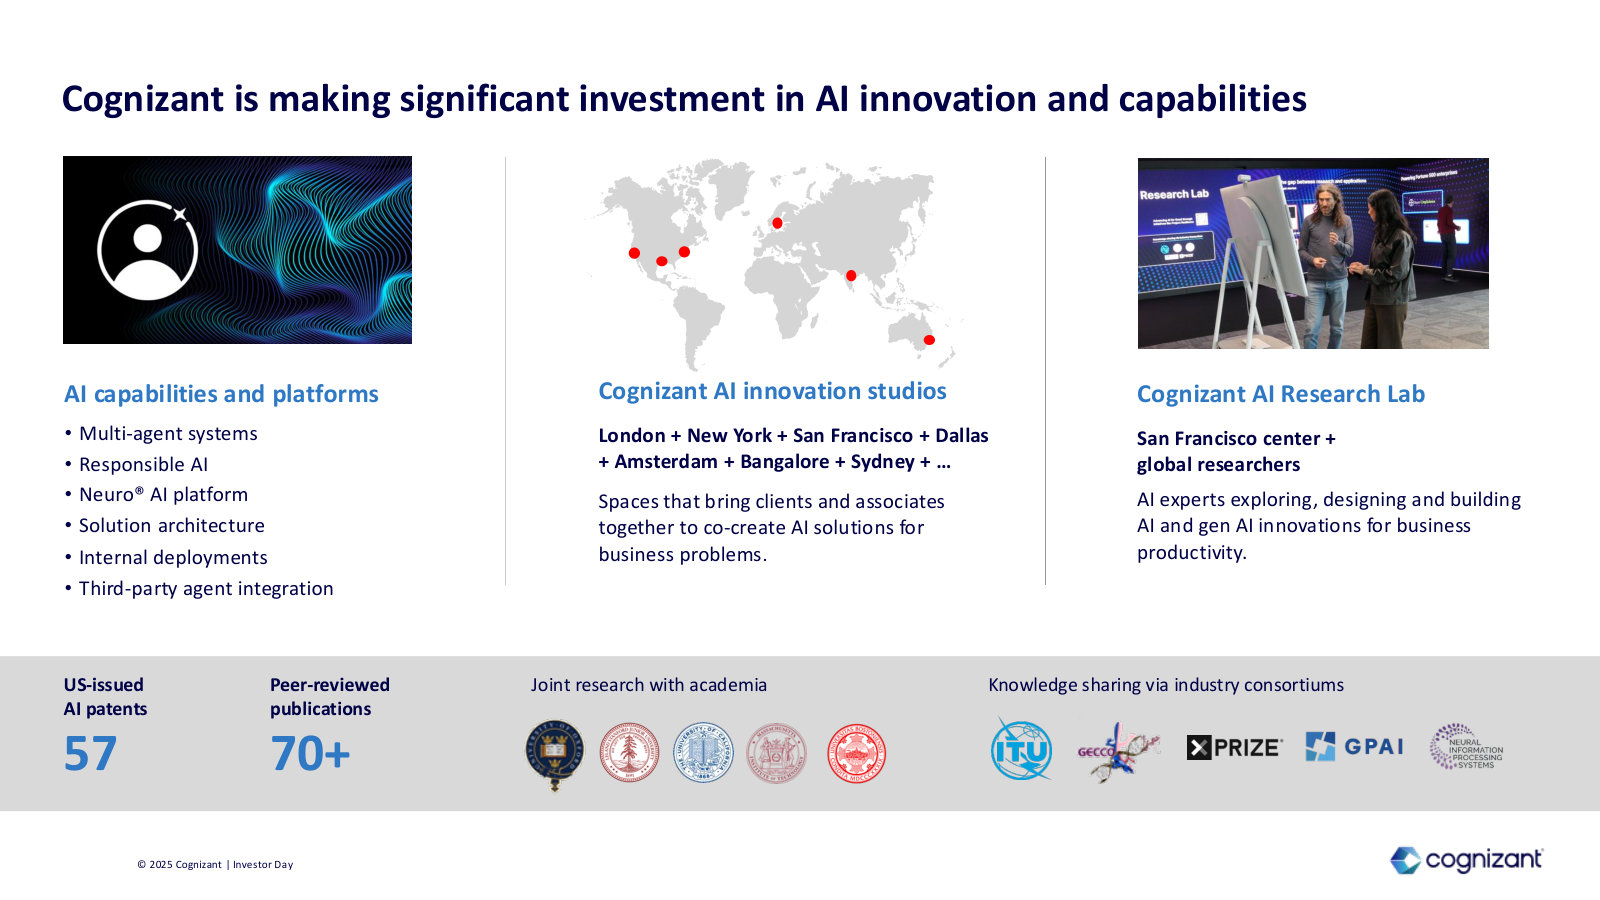
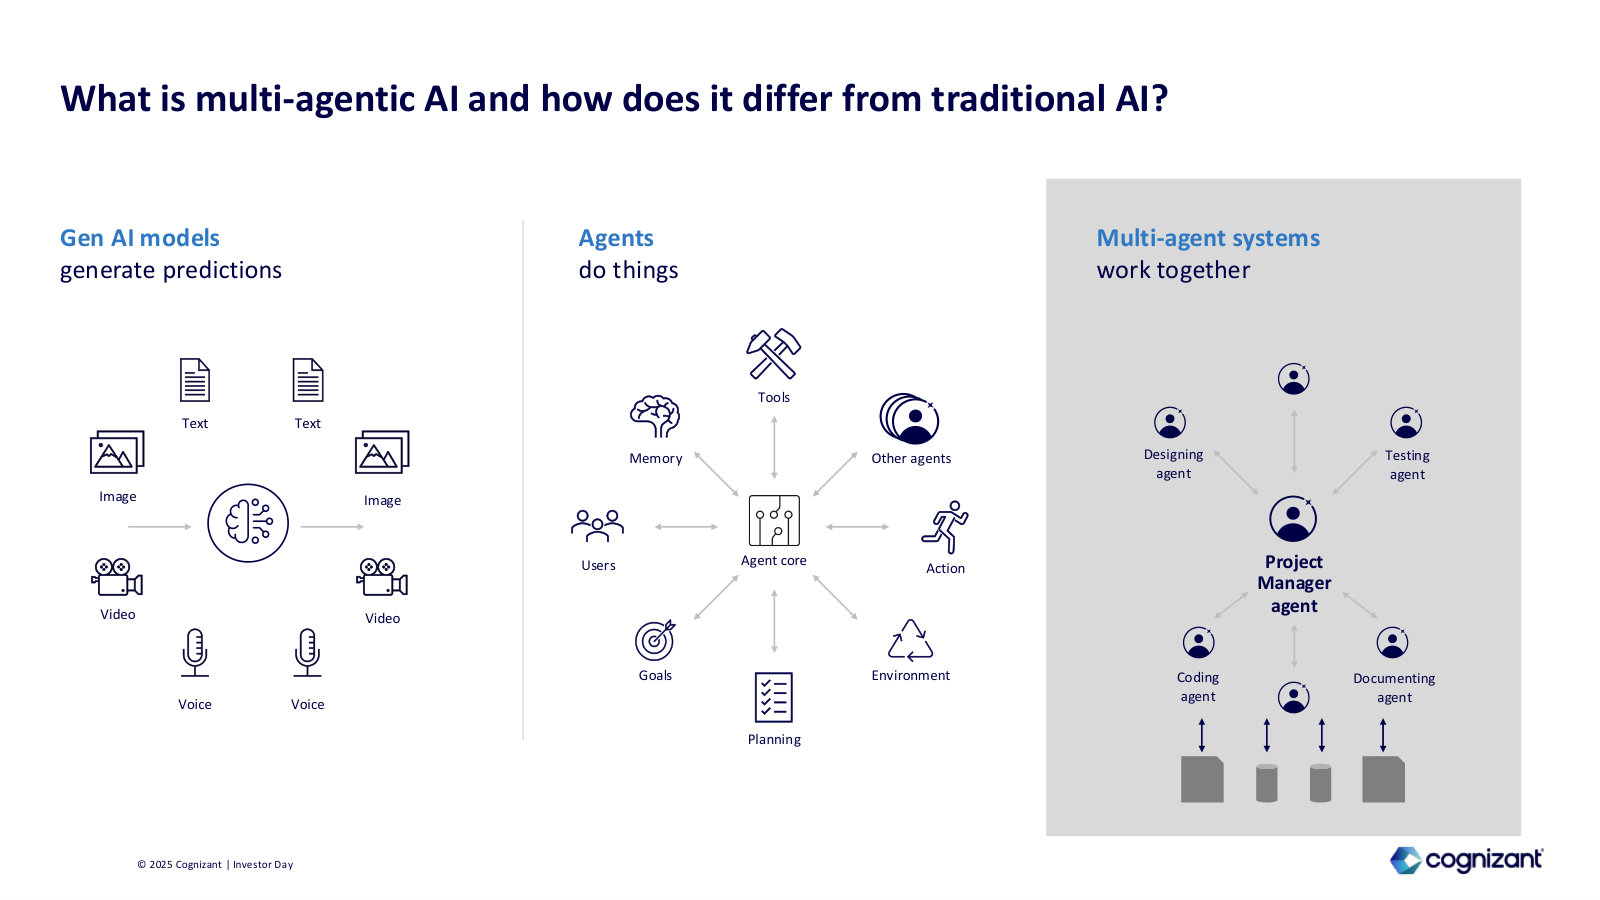
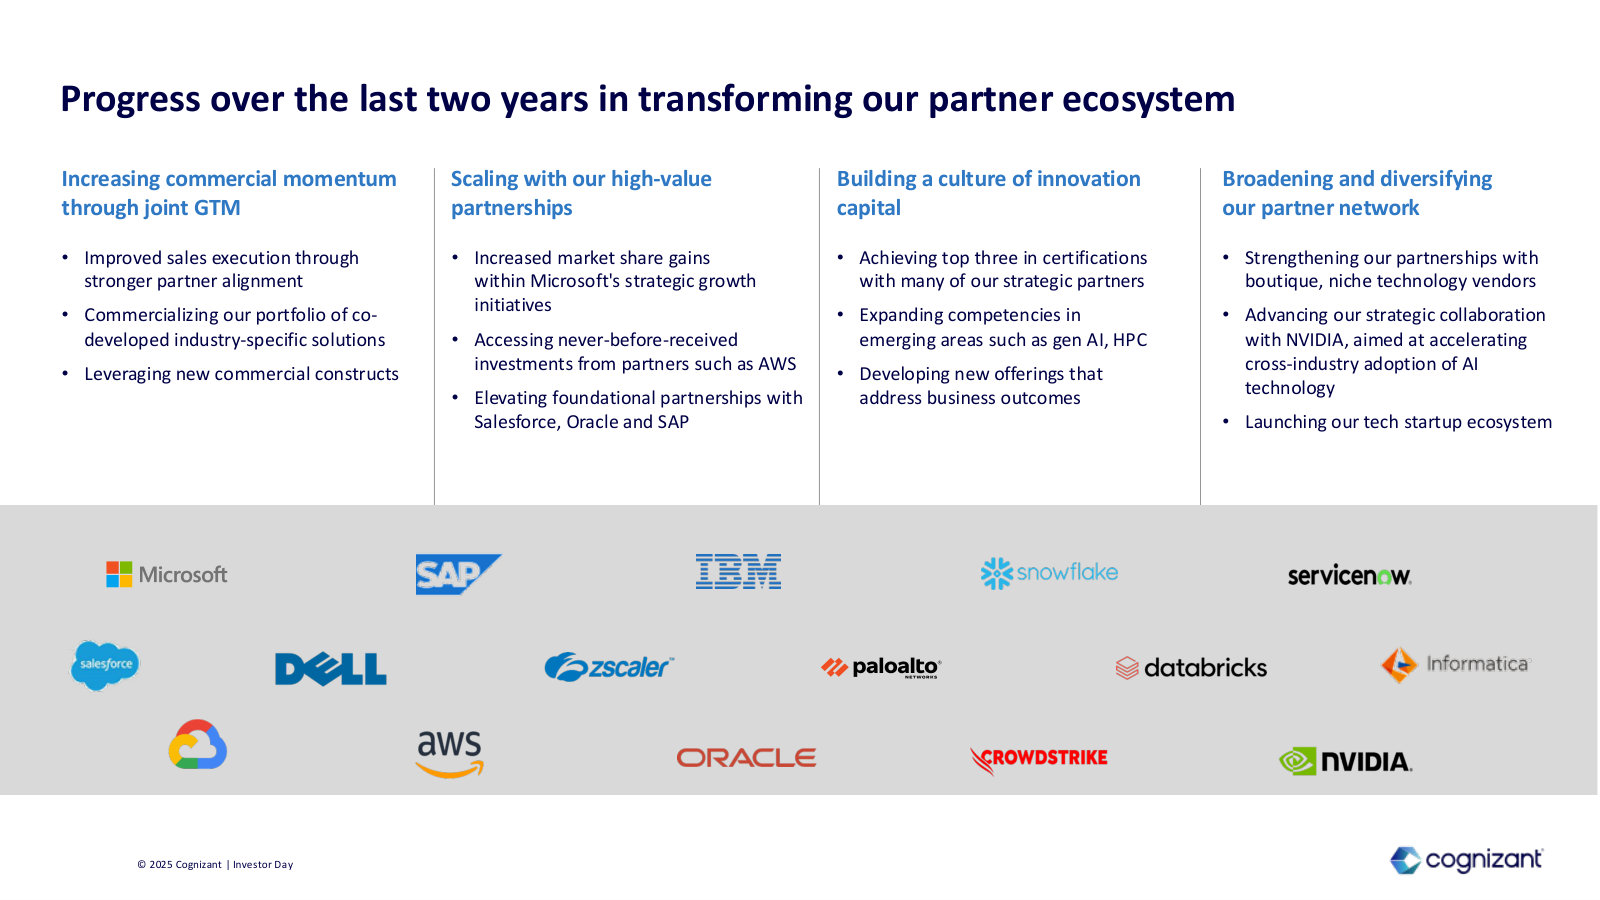
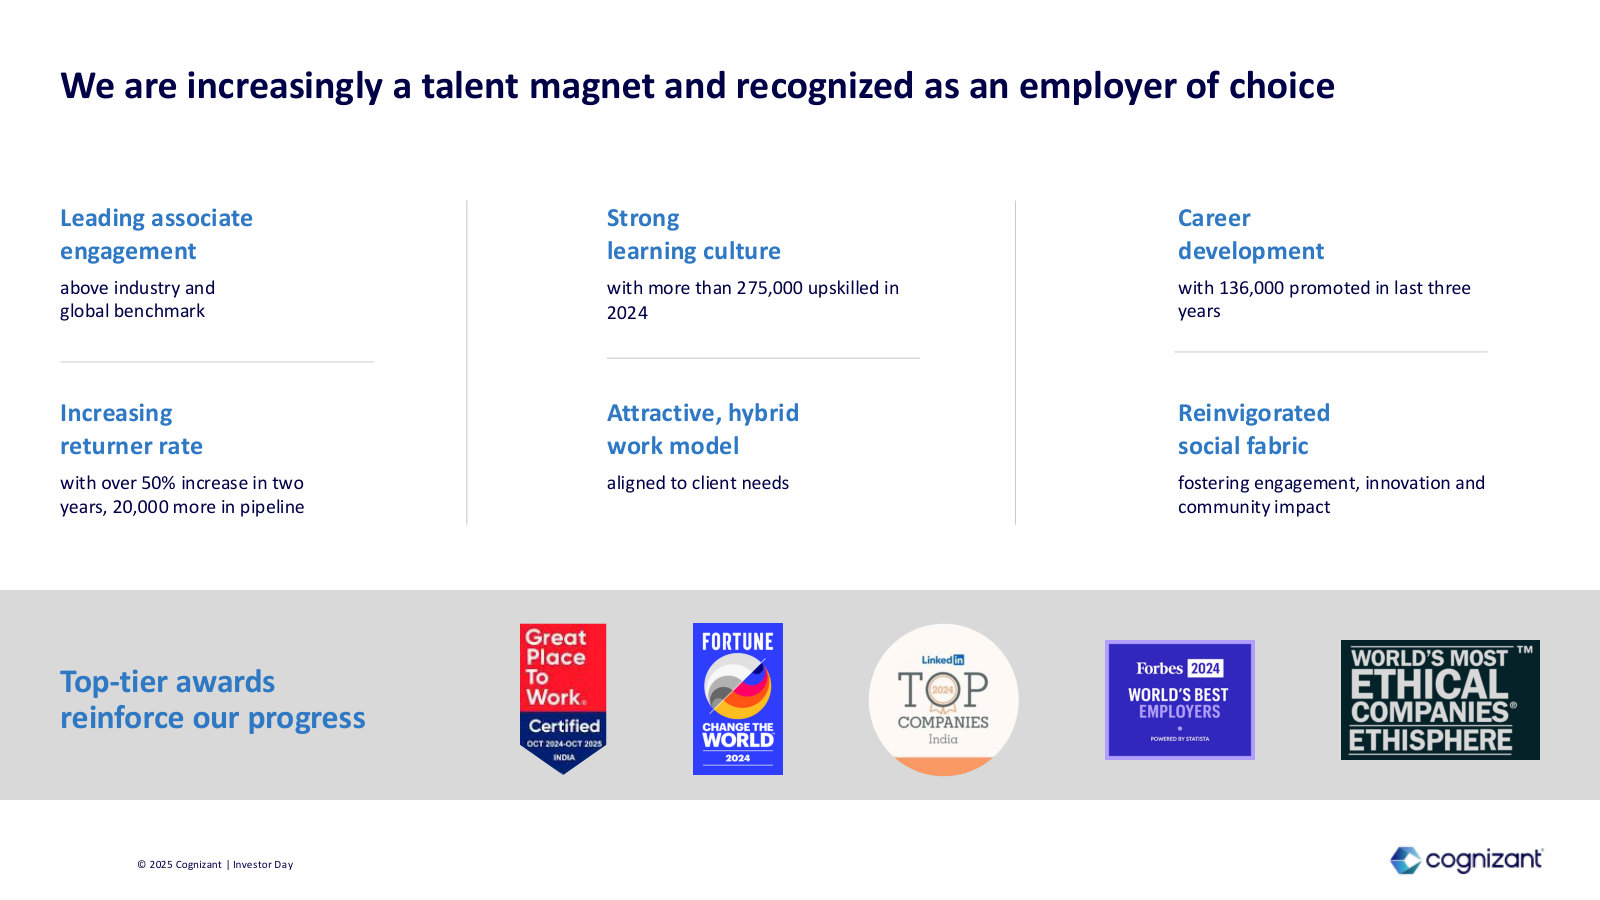
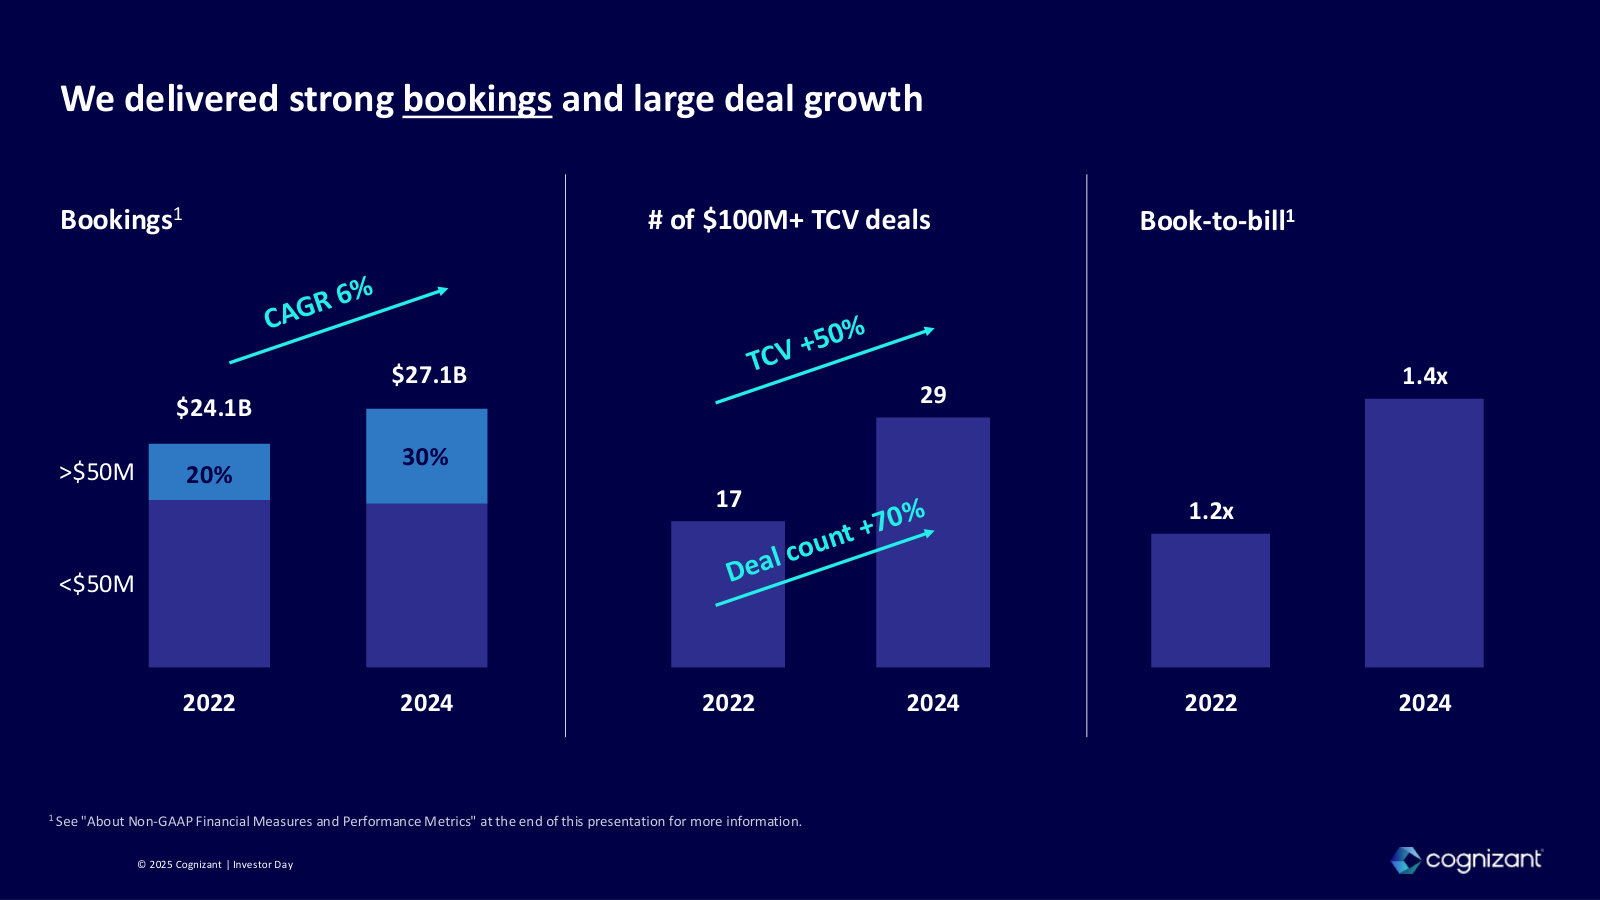
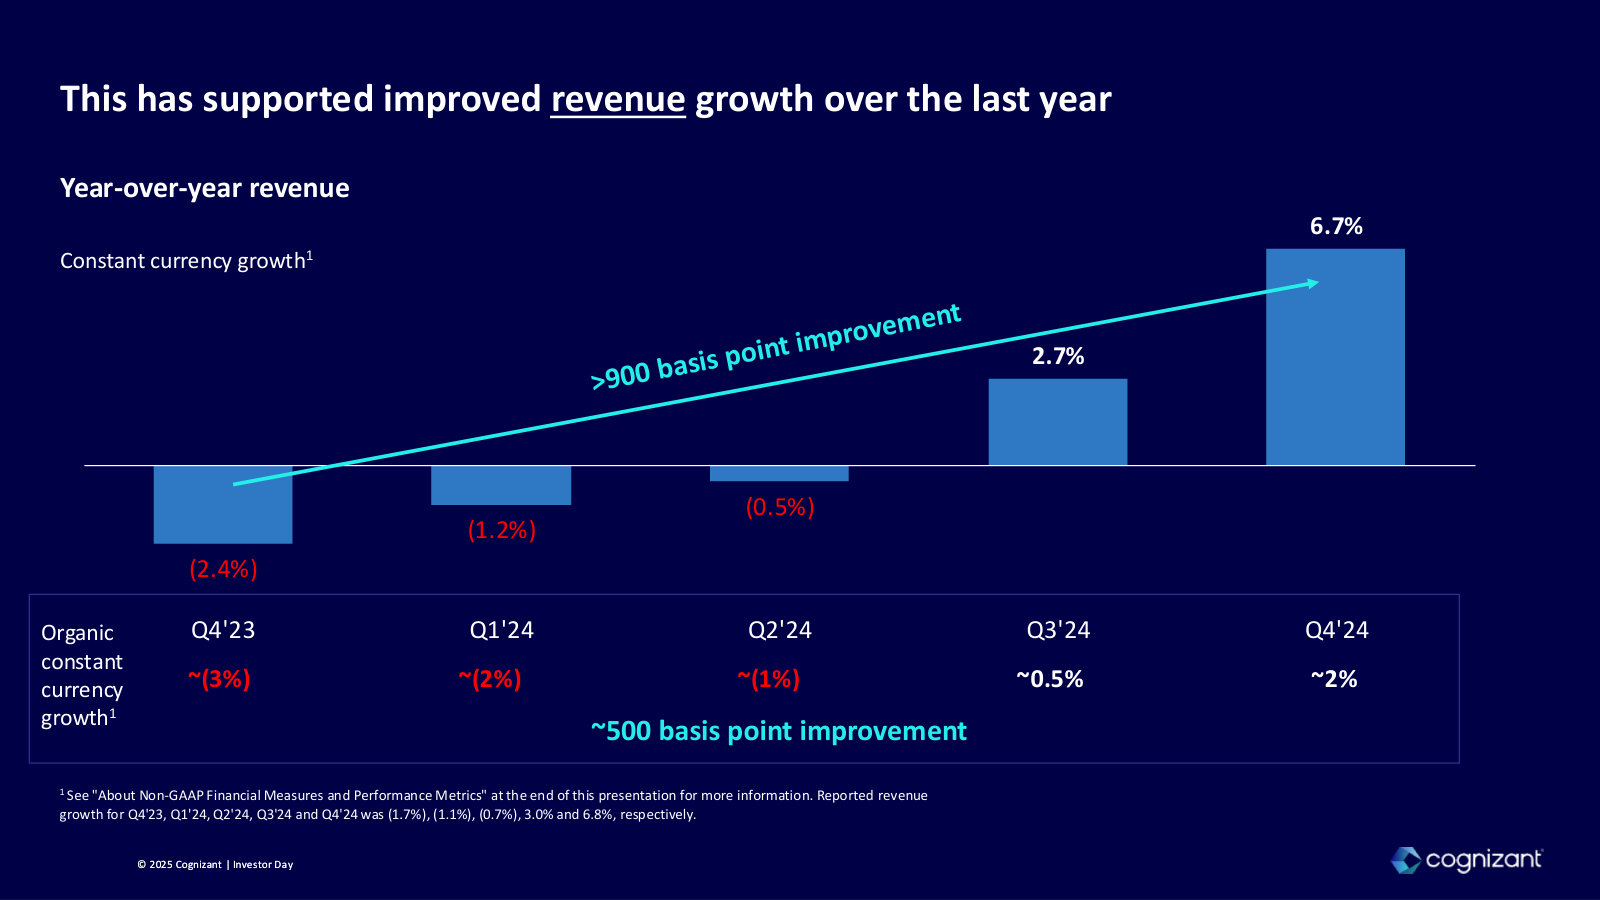
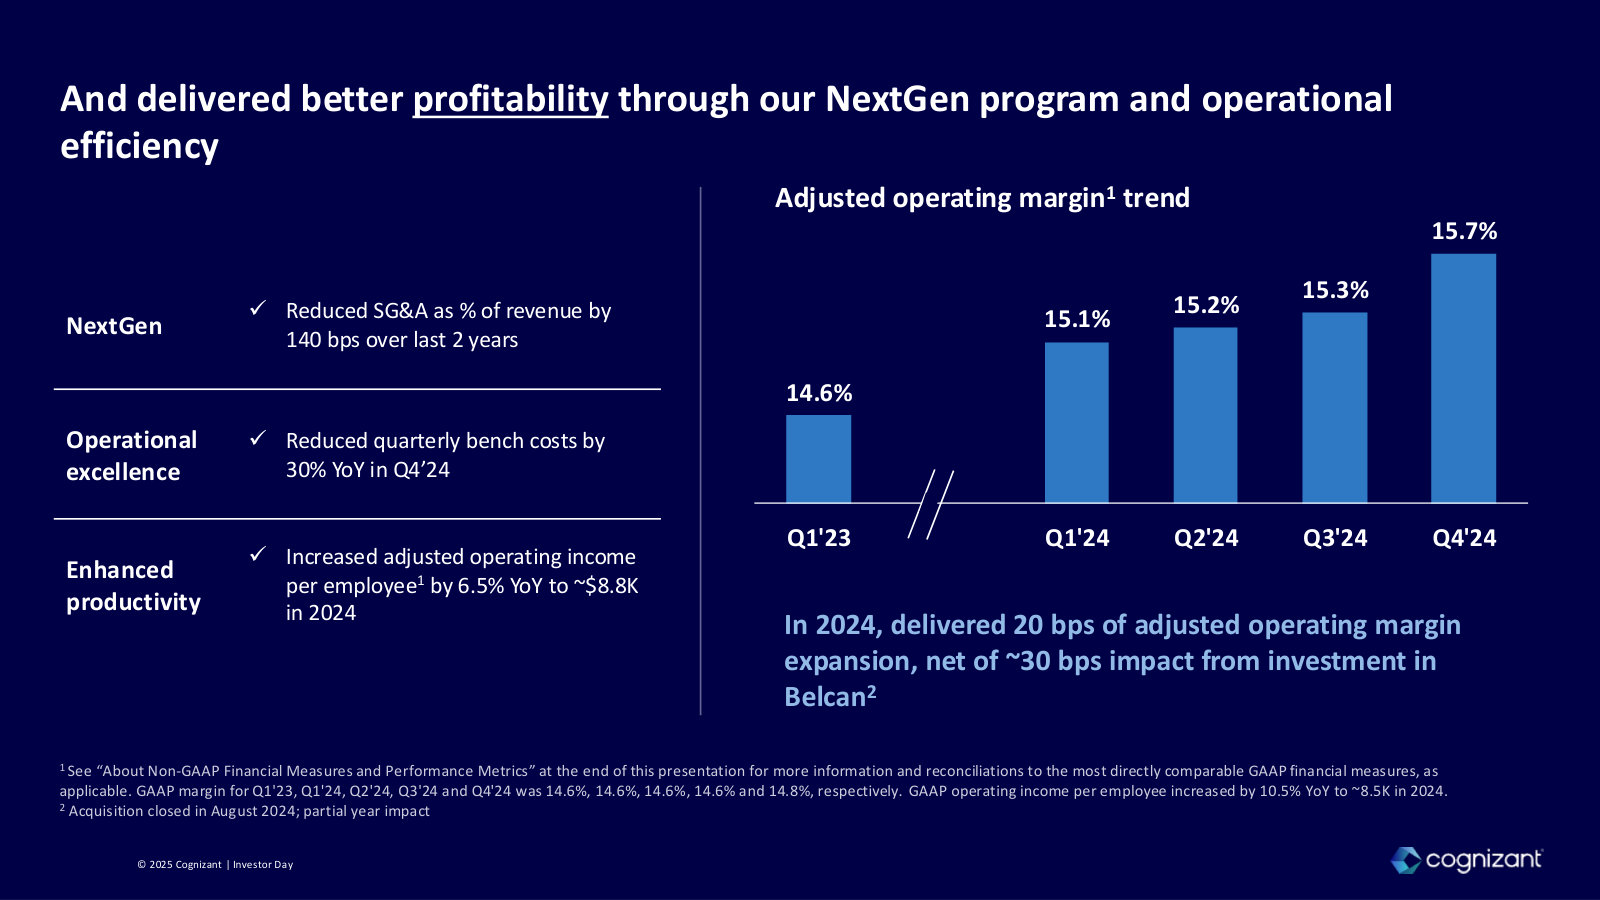
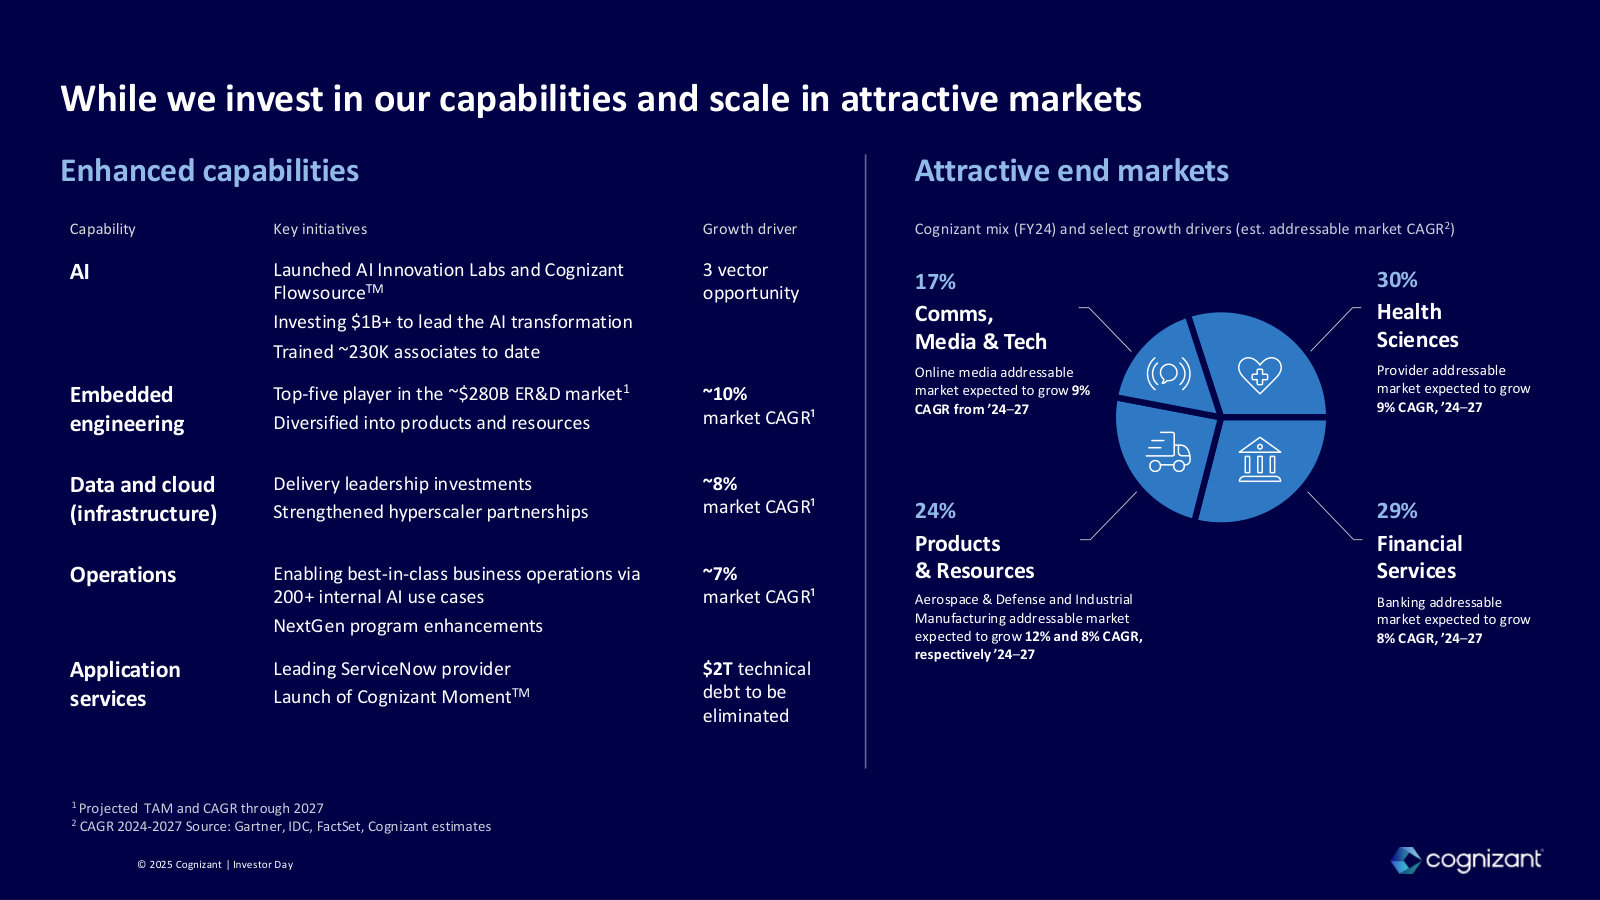
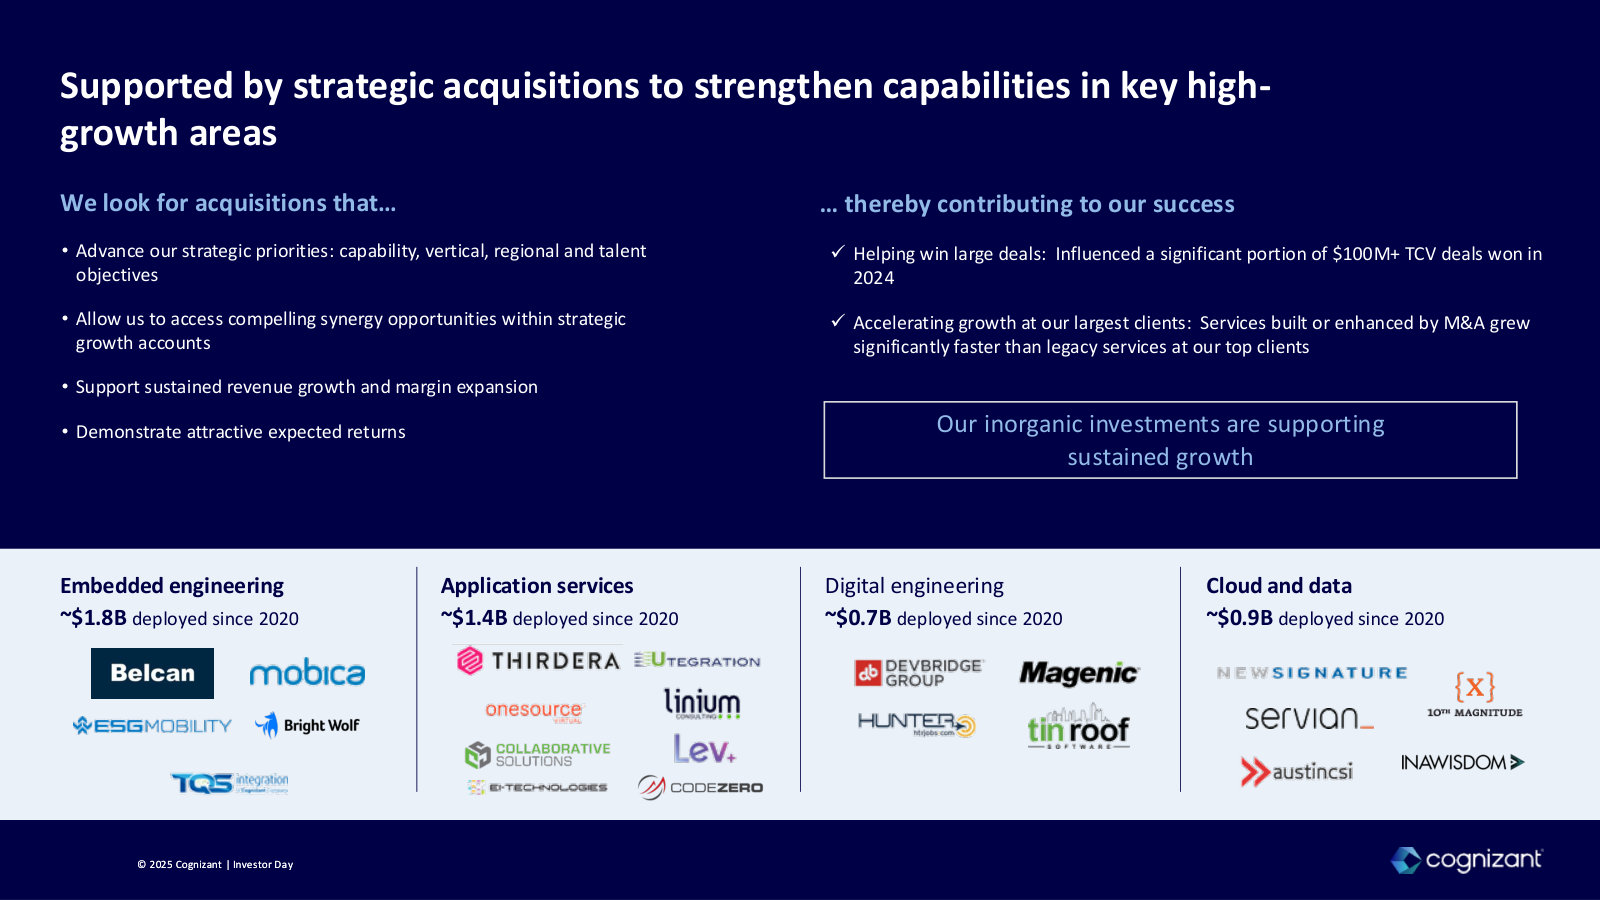
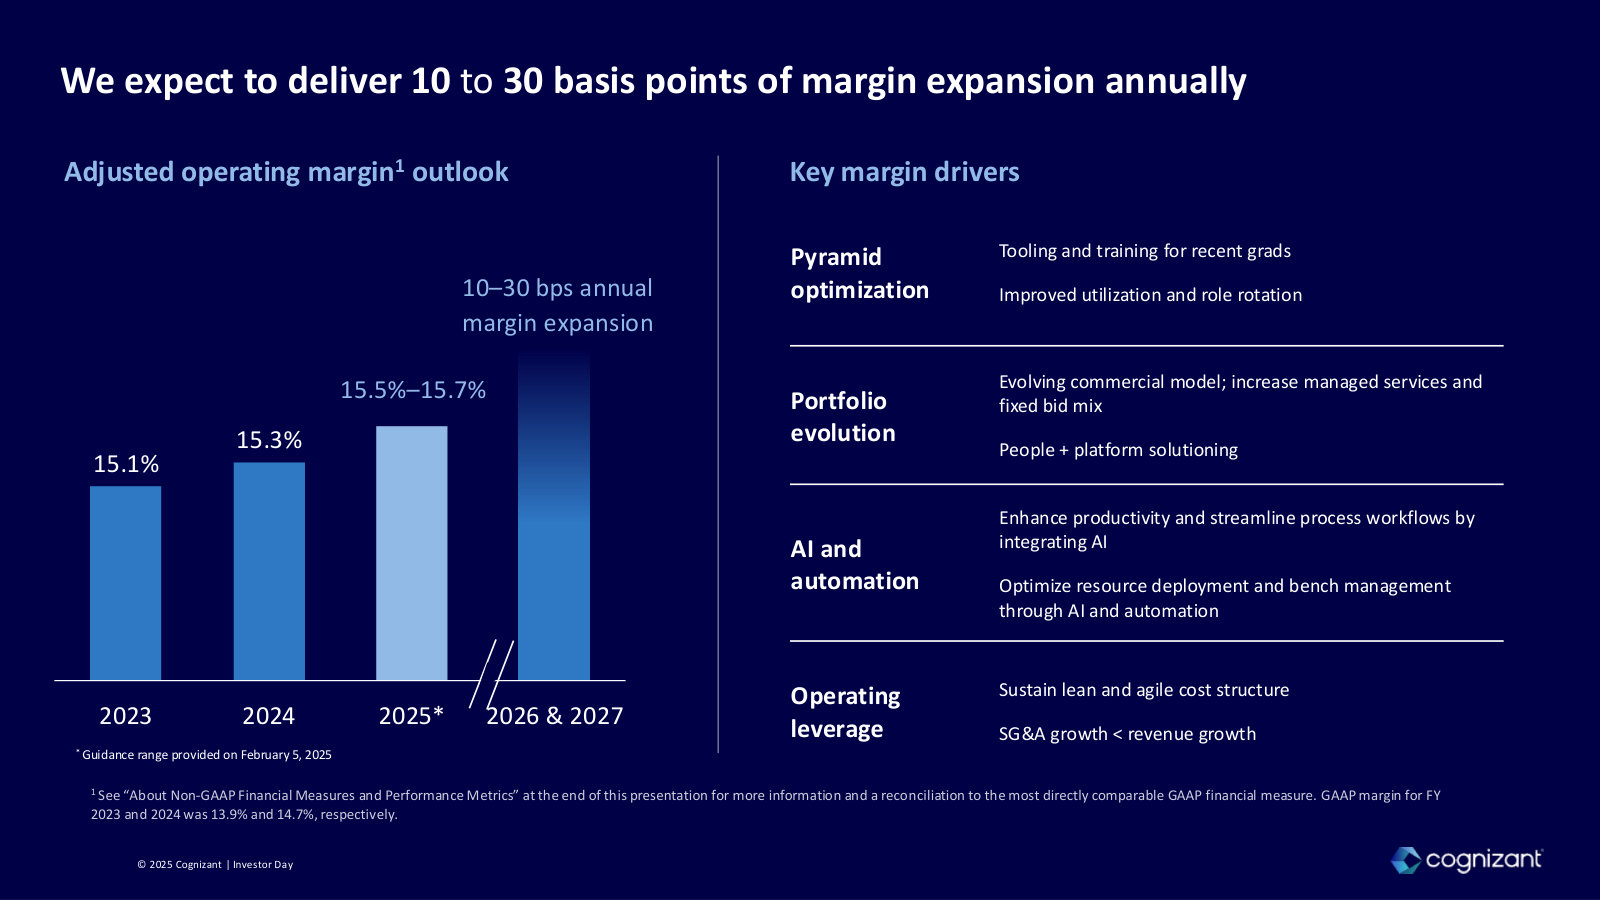
Cognizant Technology Solutions Corporation's management explains the business in its own materials. The slides below do the most of that work, pulled from the documents preserved in Sources. Each source link opens the complete presentation at that slide in a new tab.
Investor Day 2025 — 2025
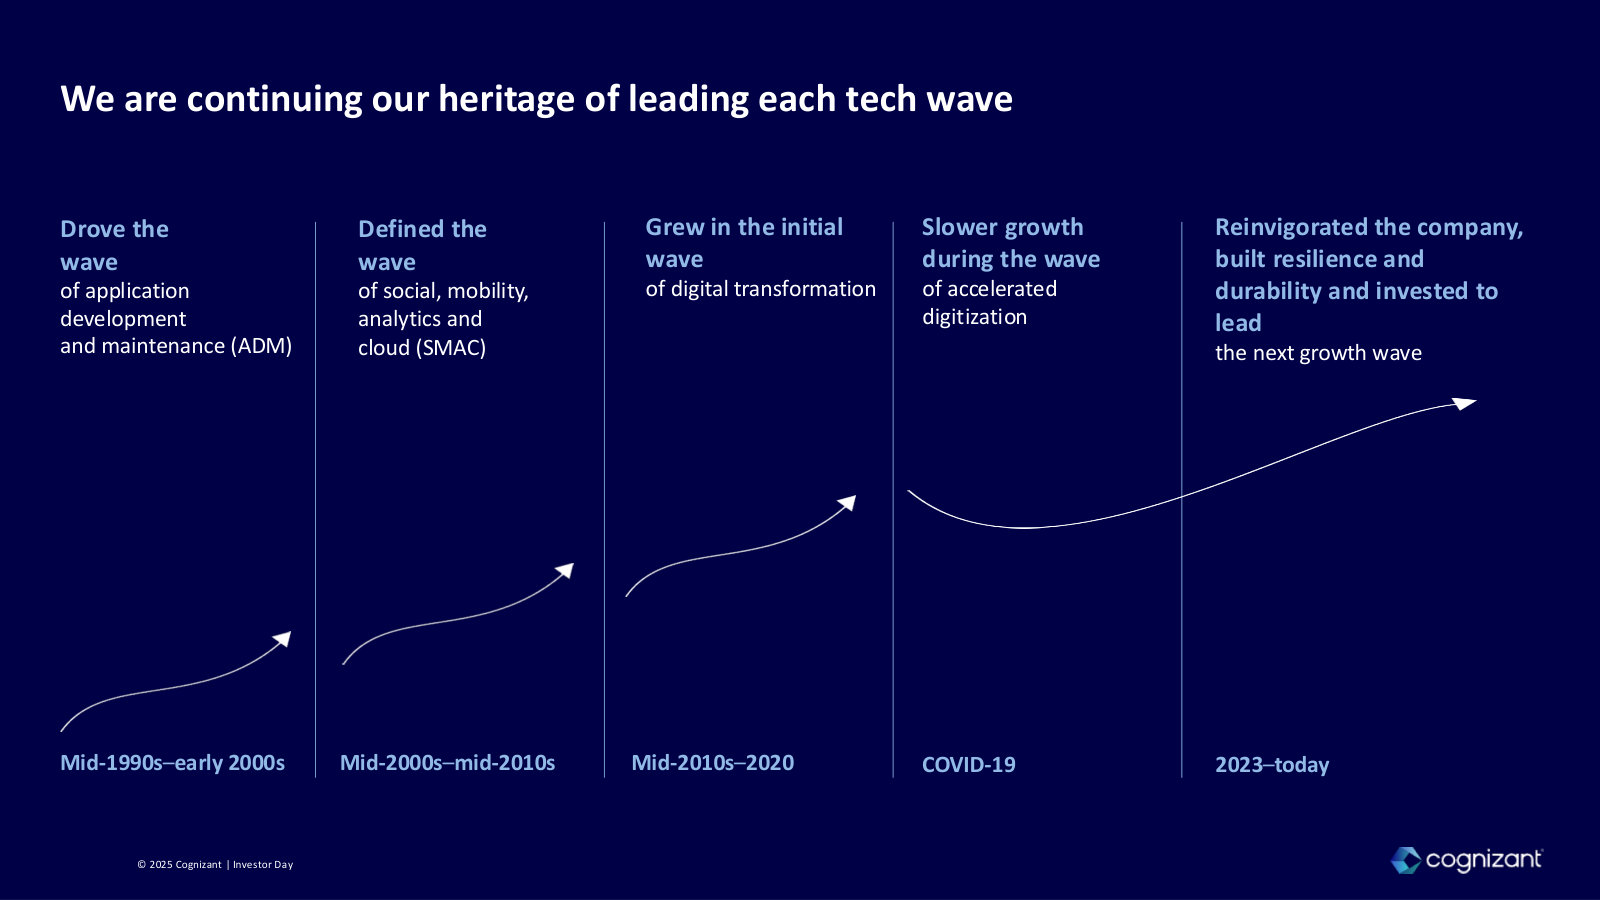
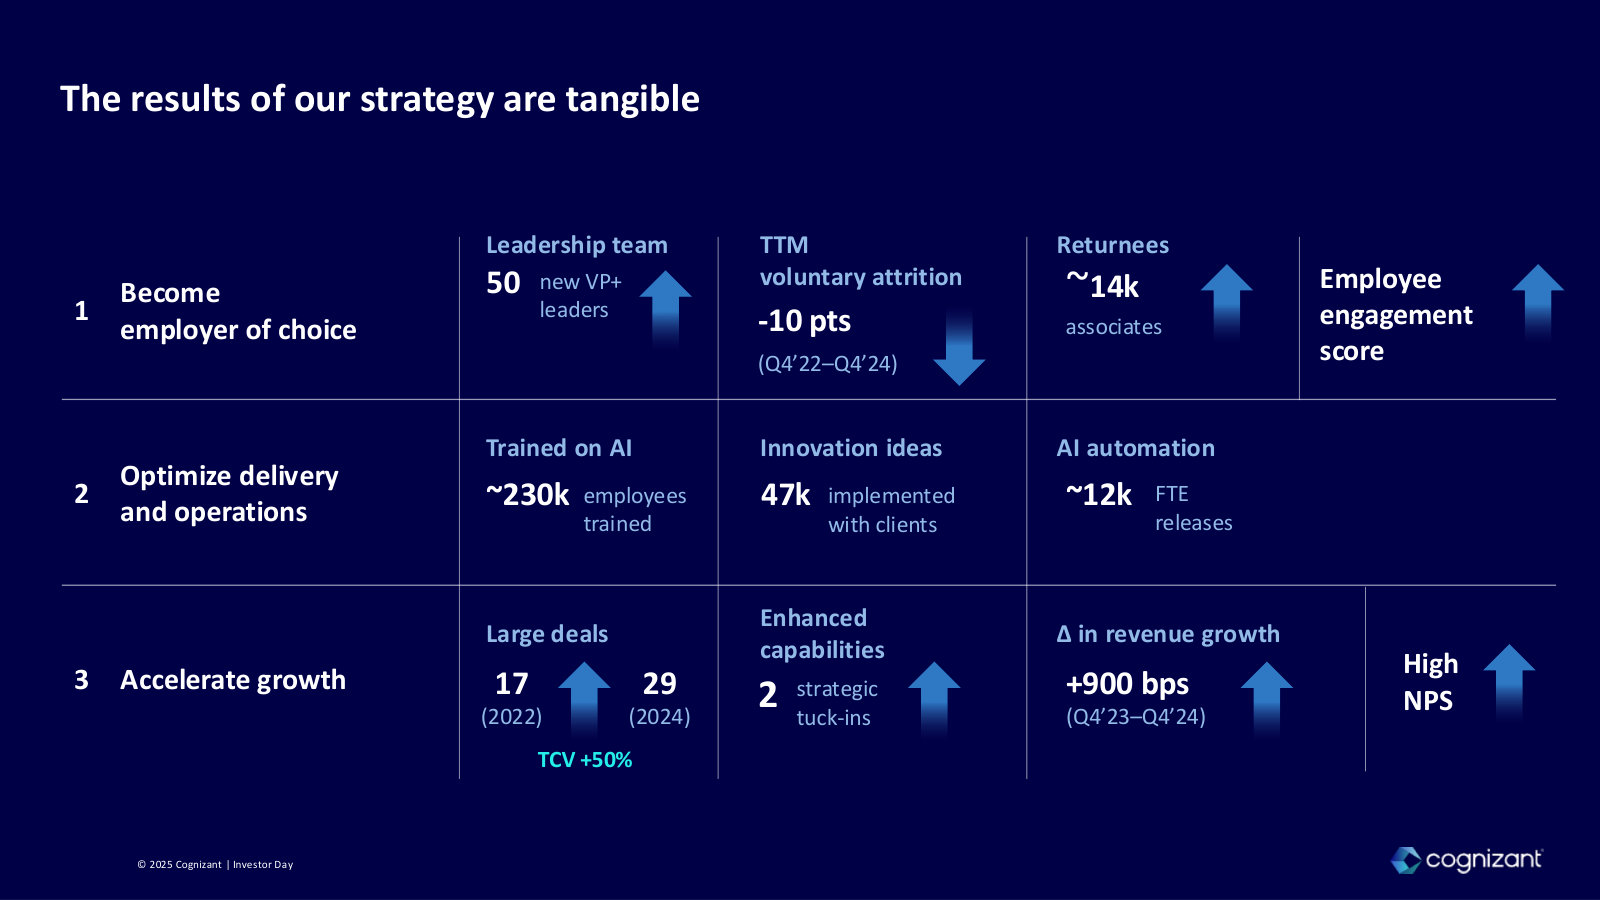
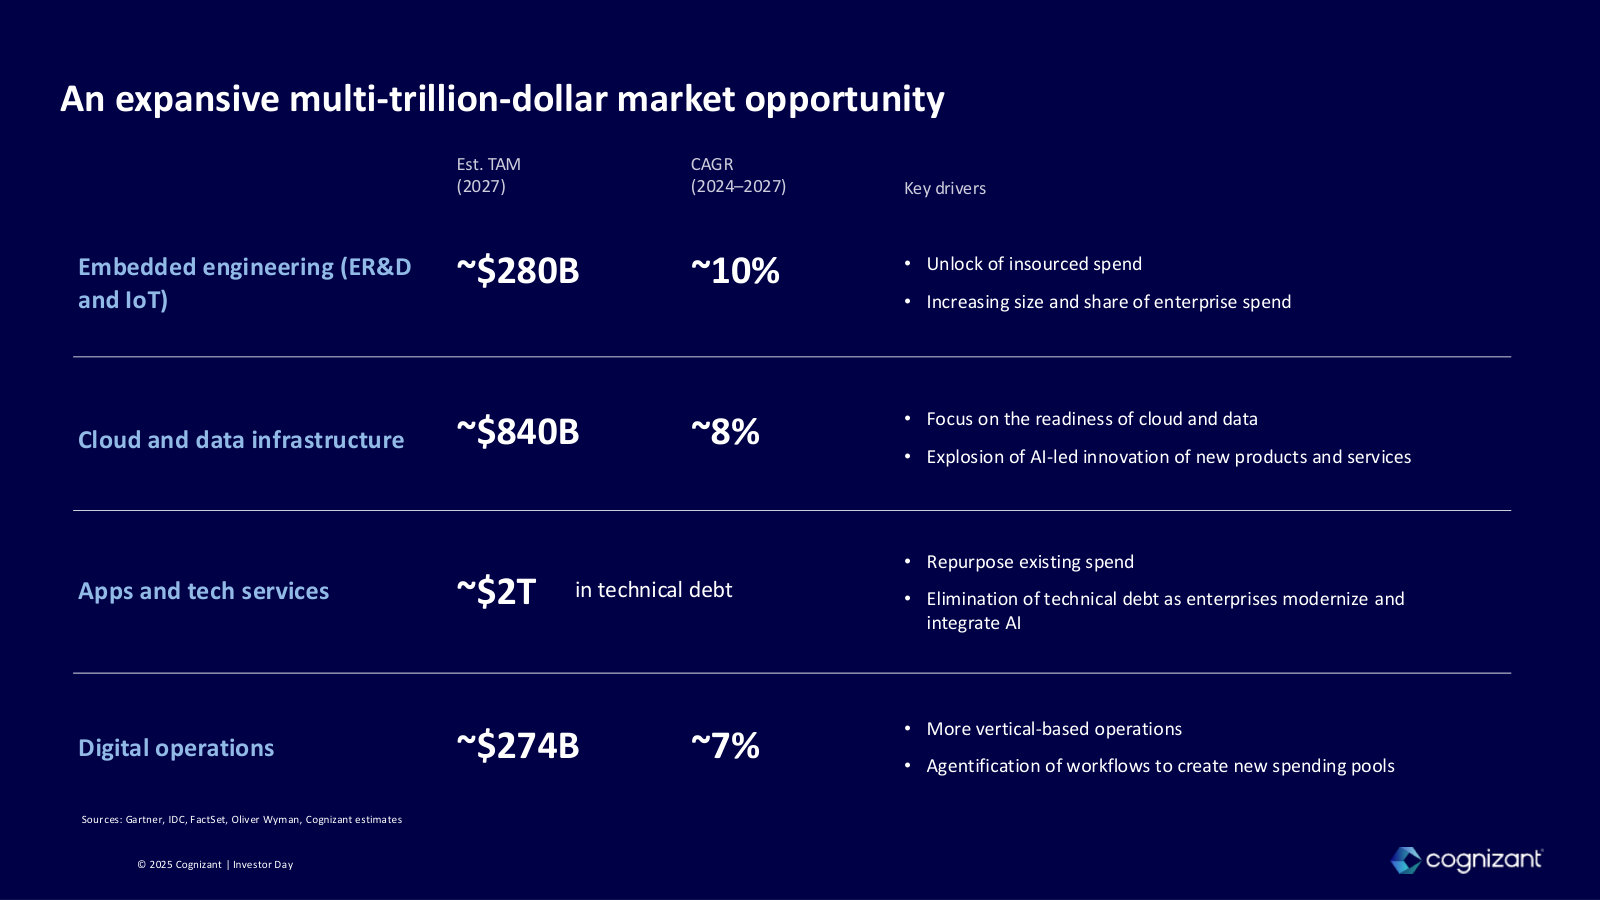
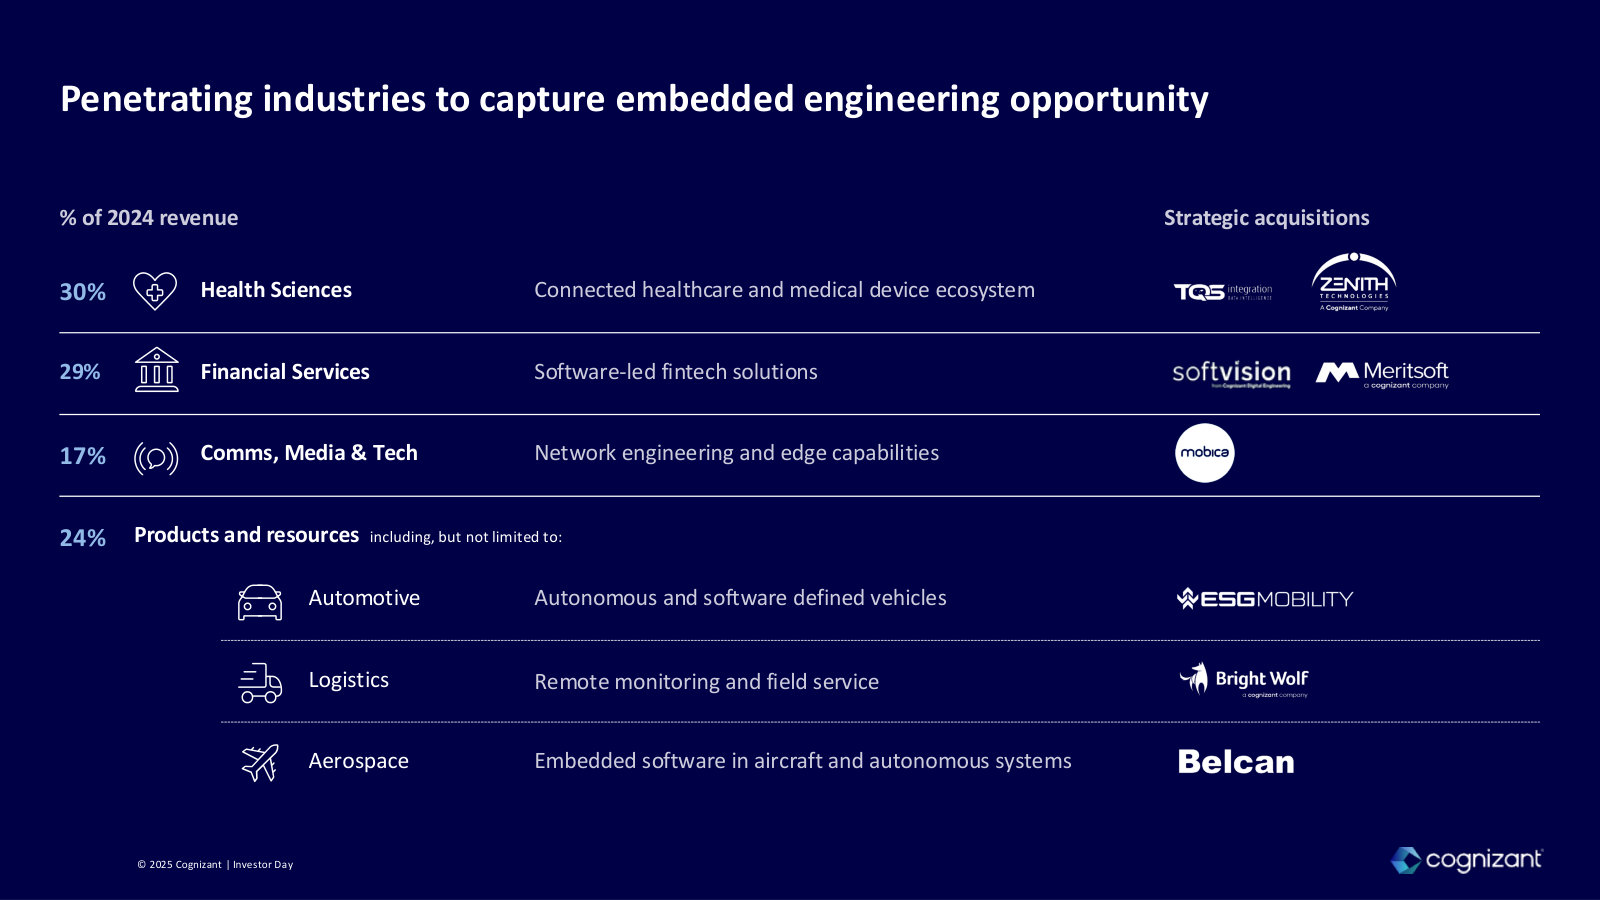
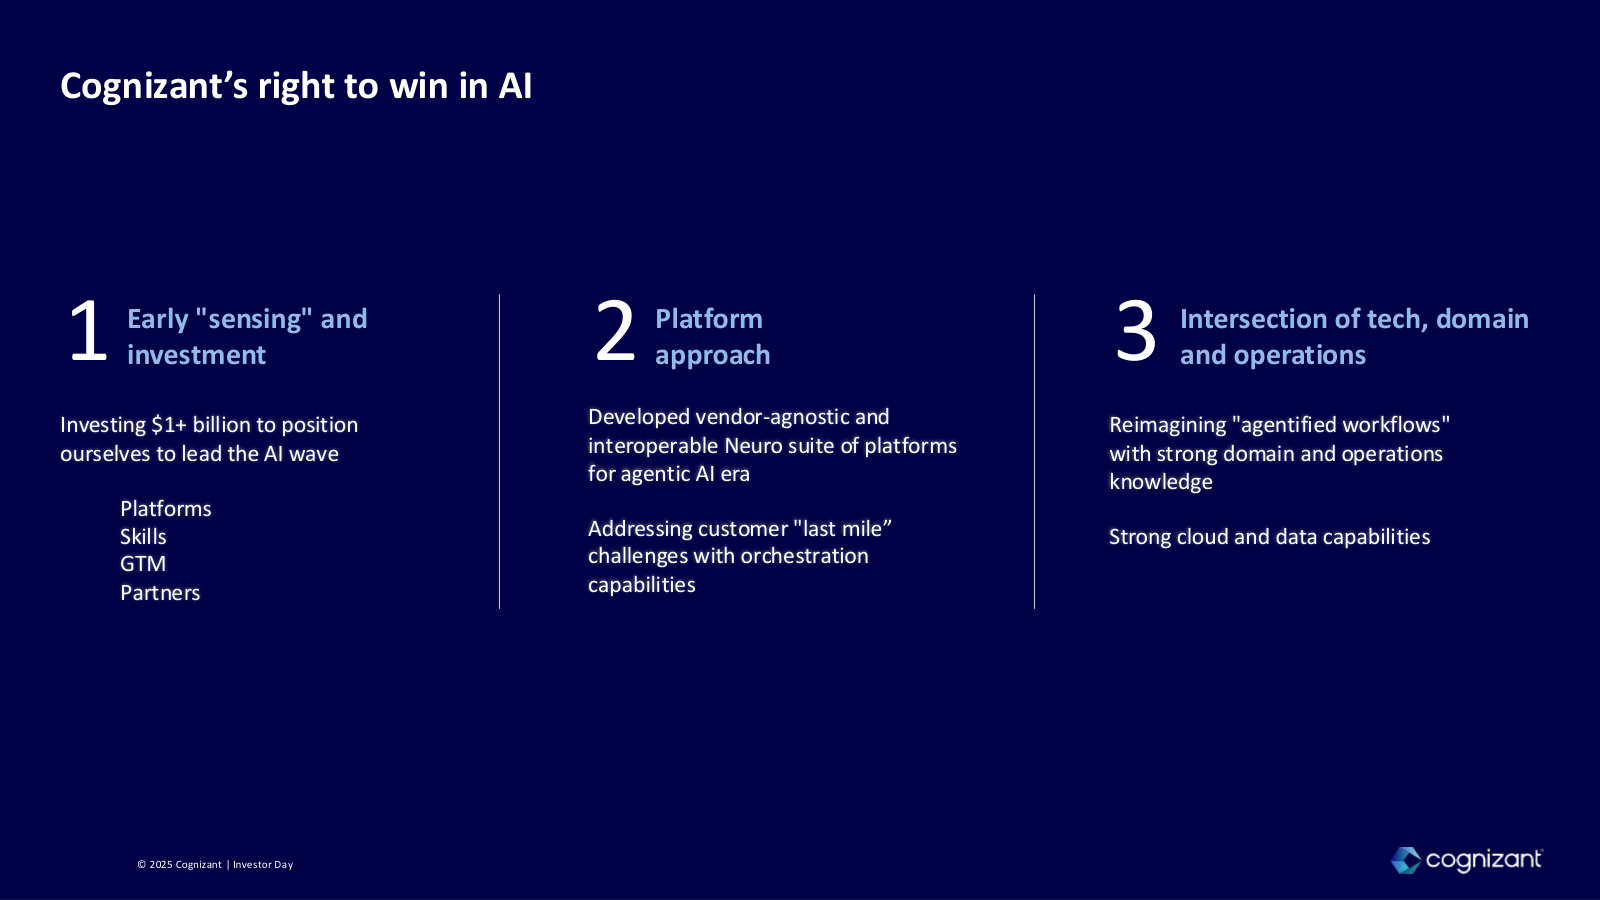
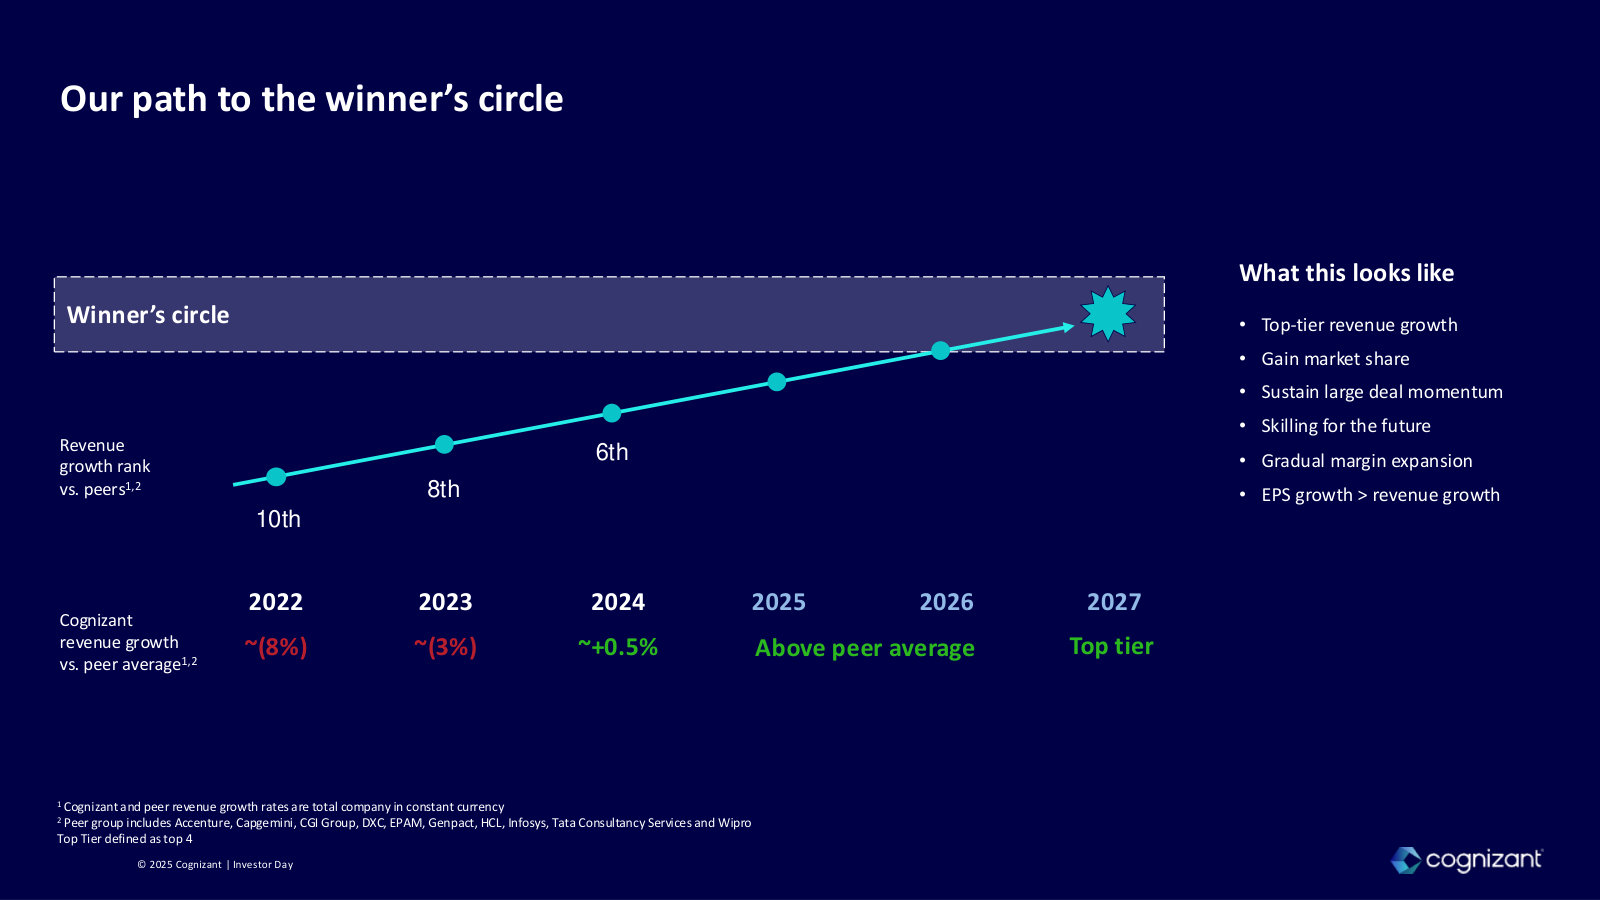
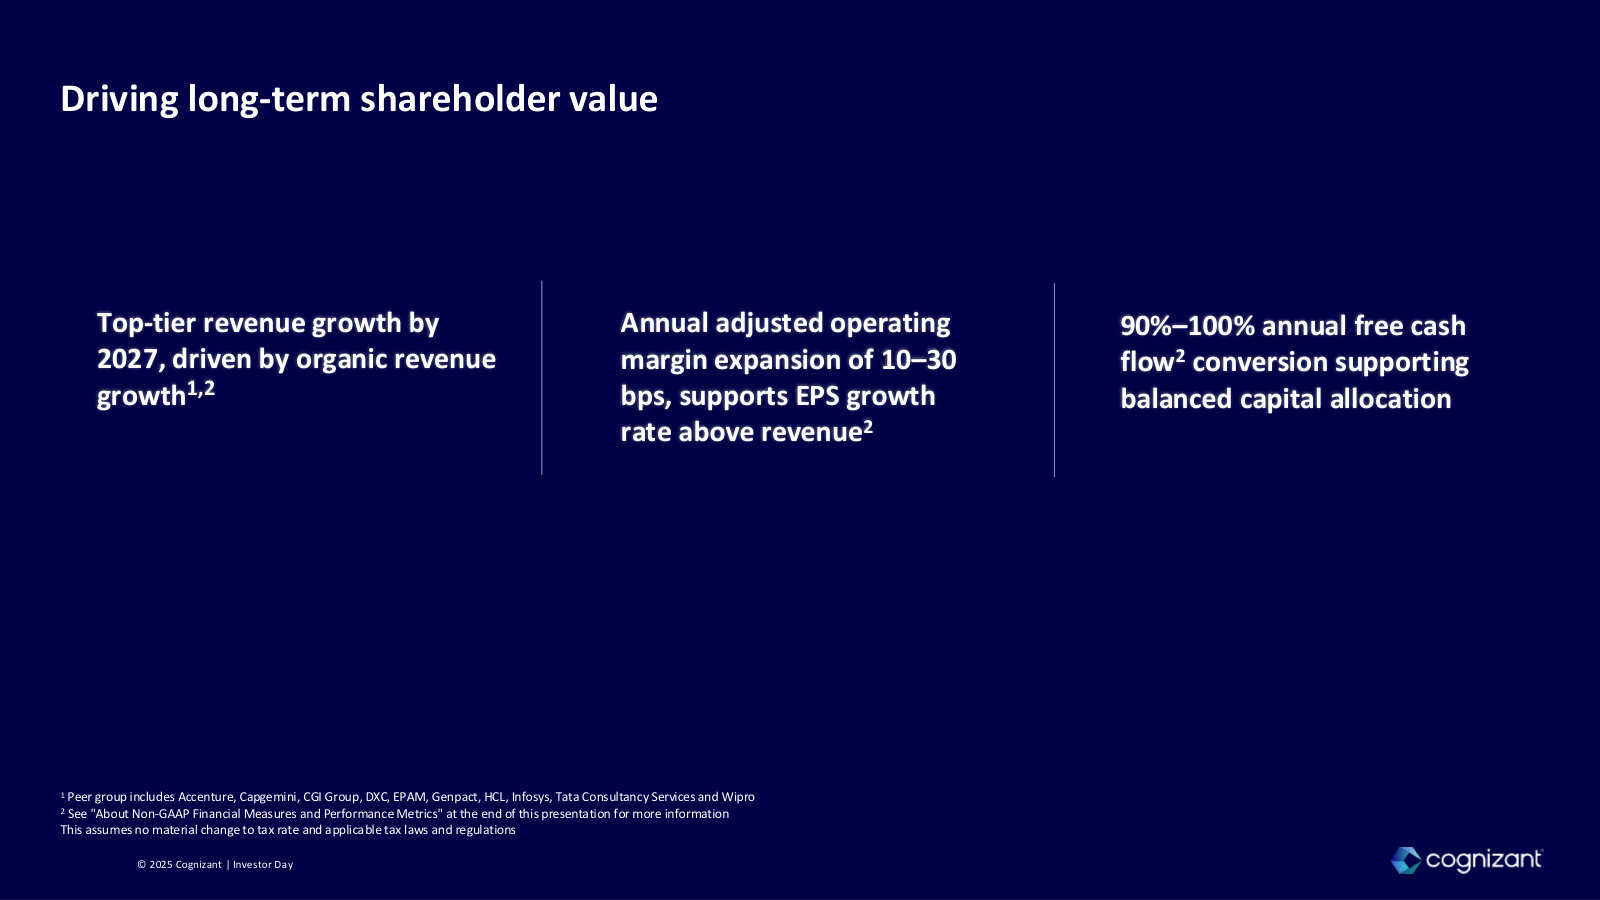
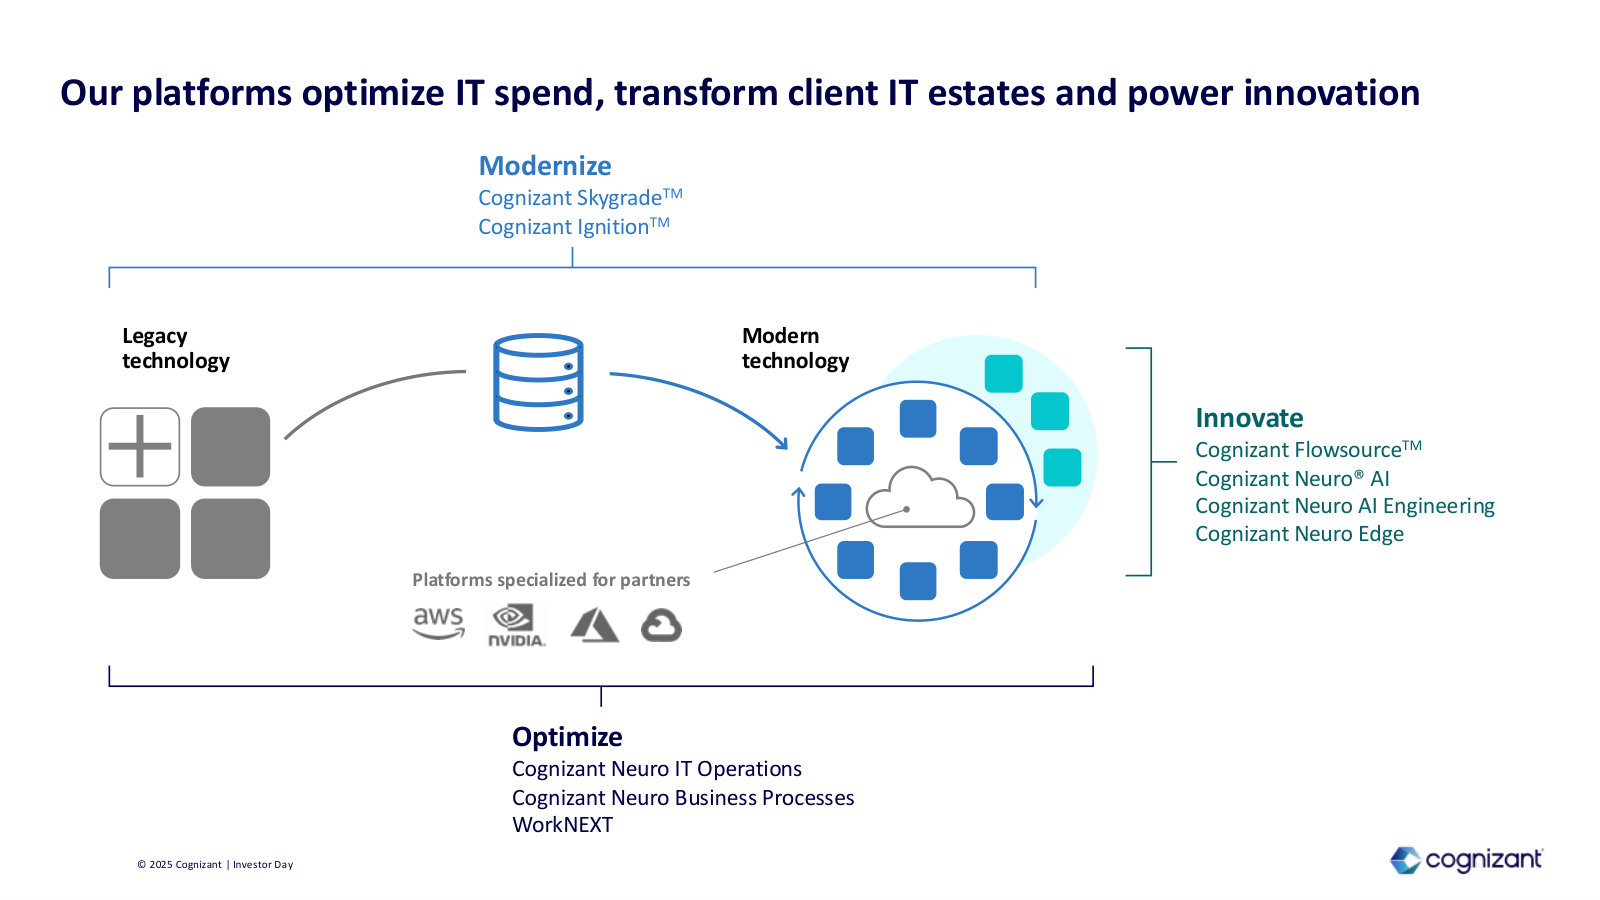
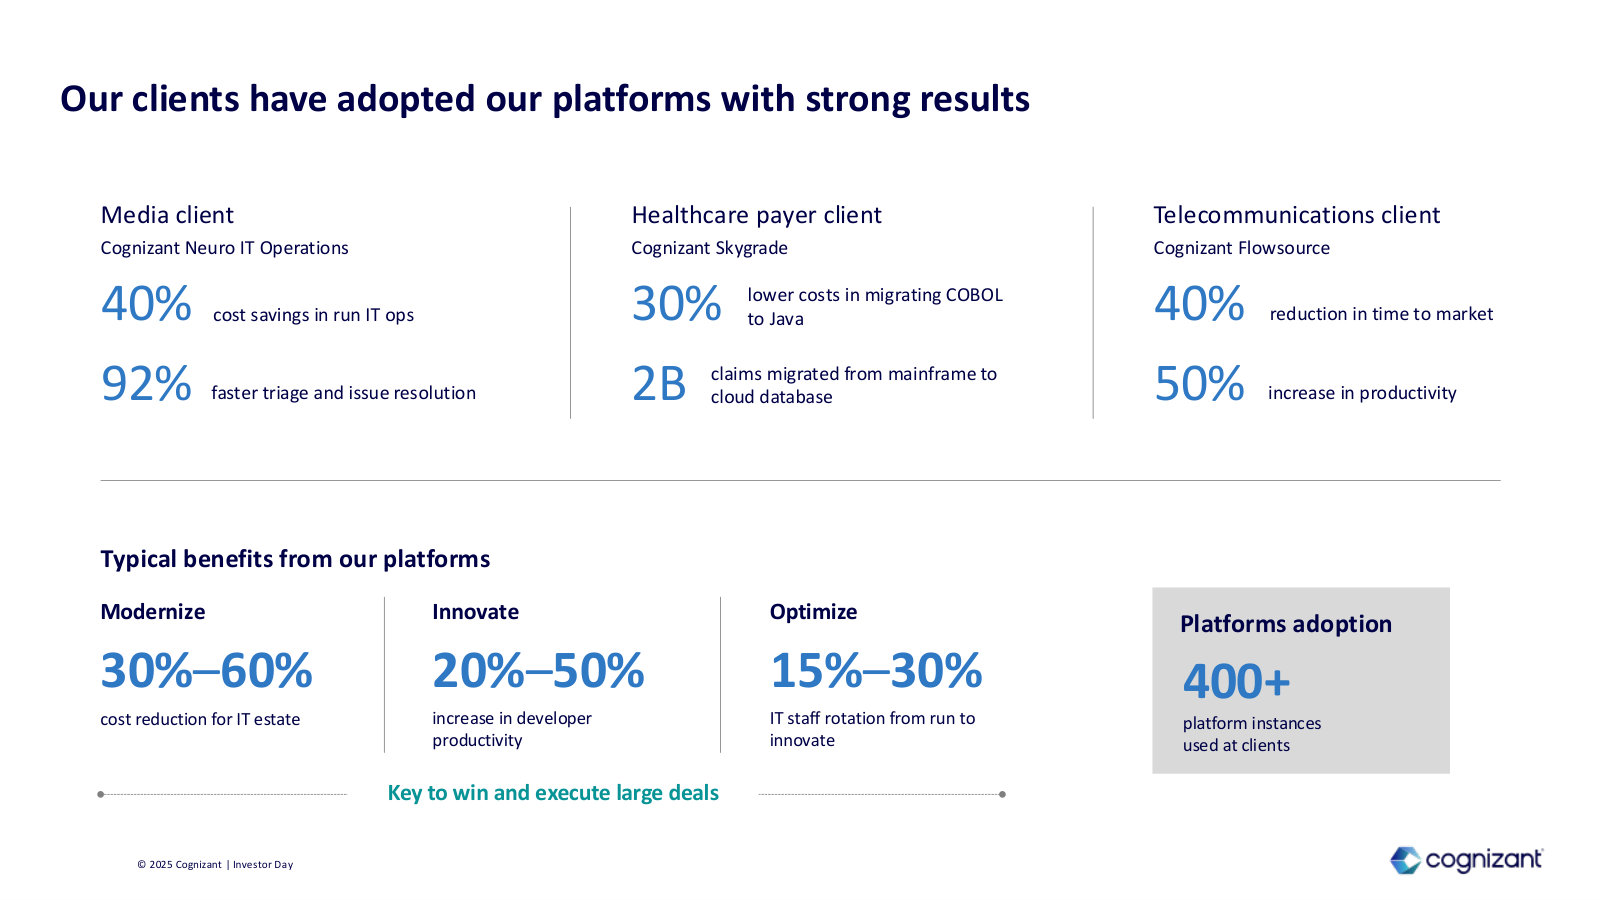
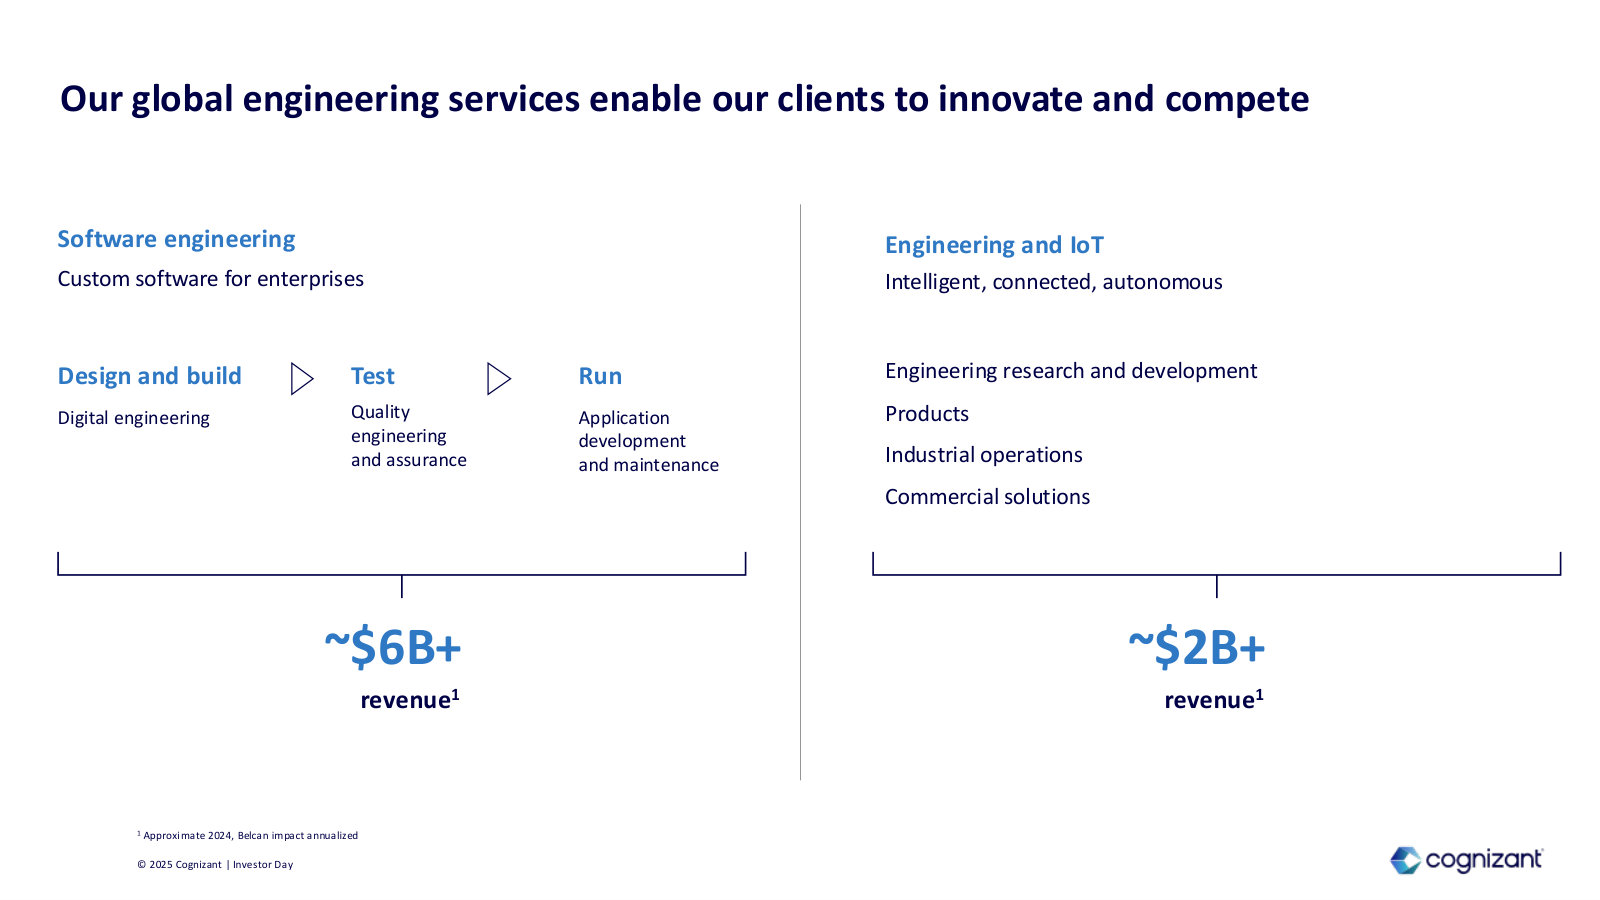
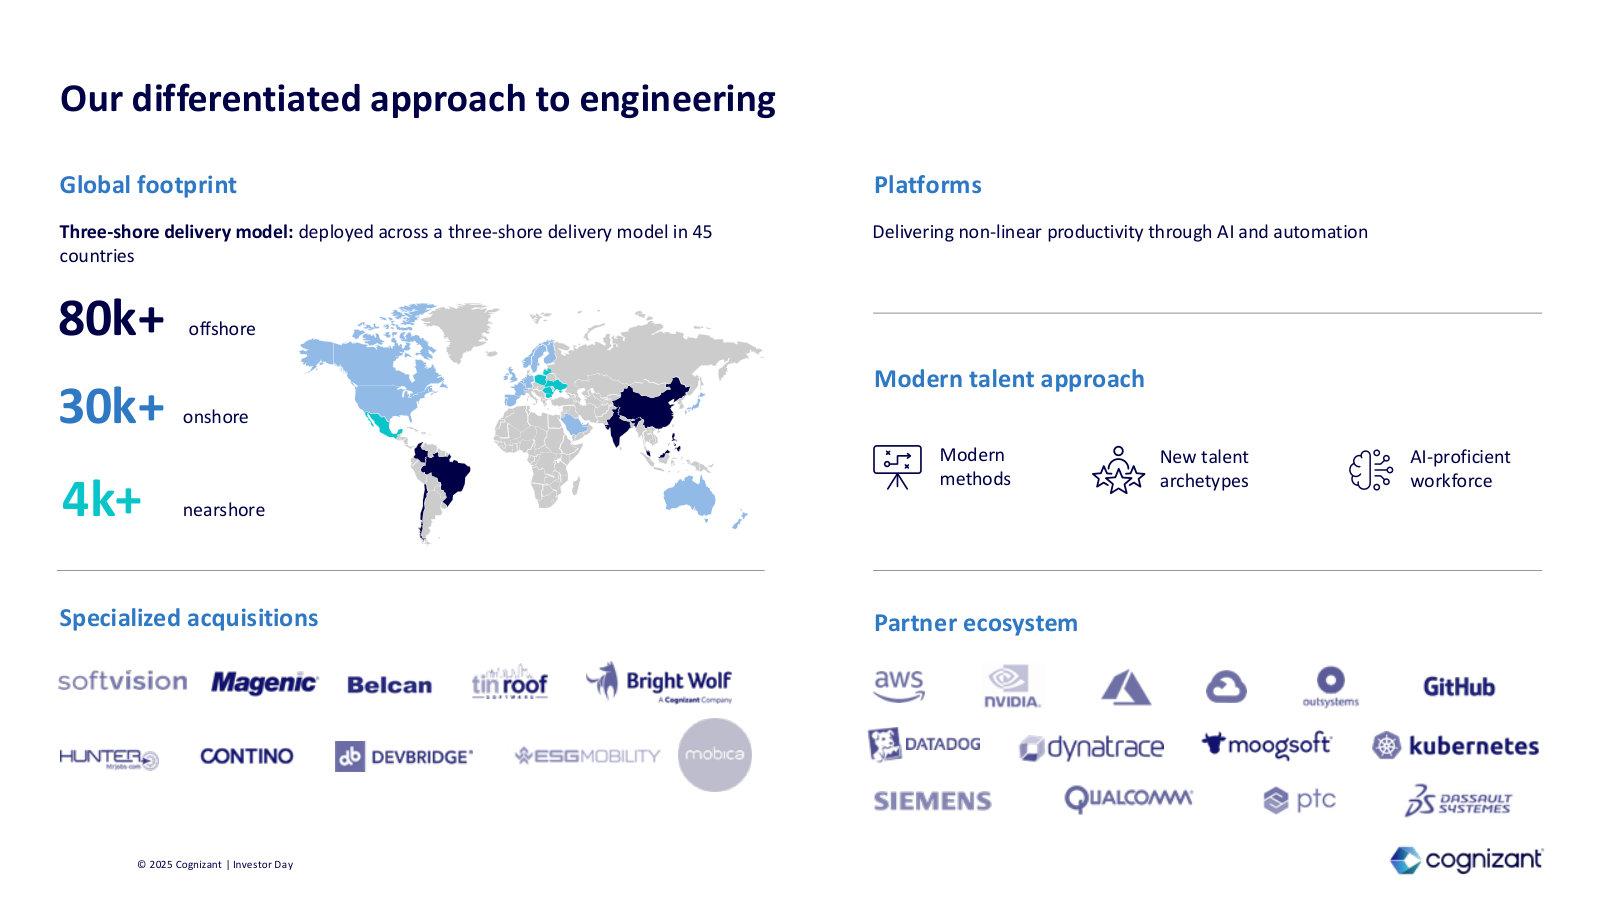
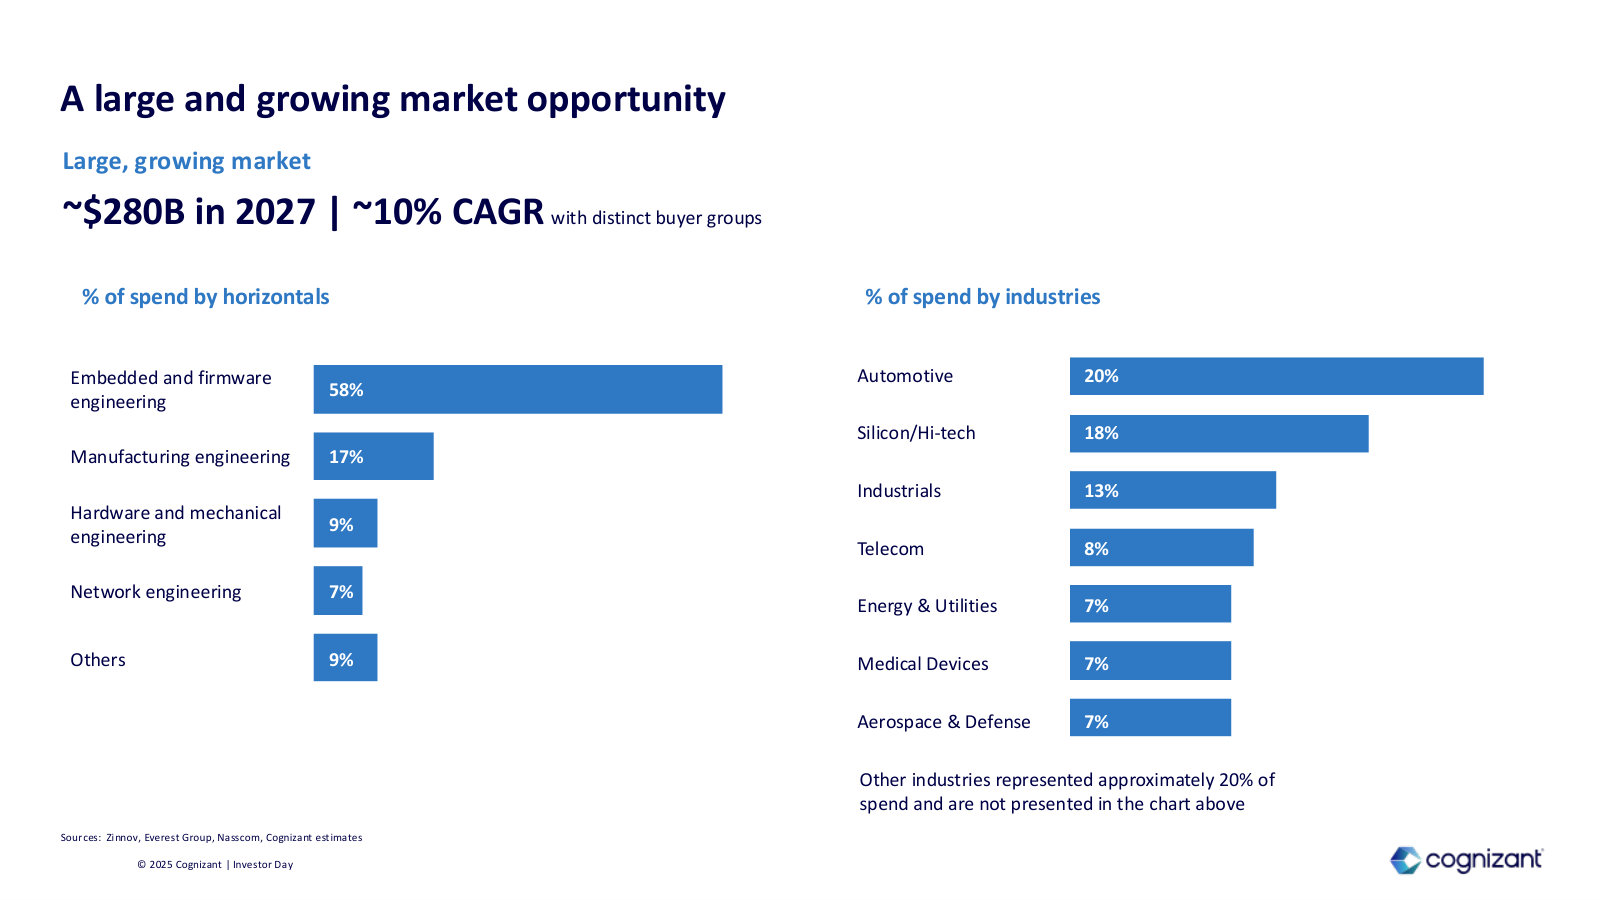
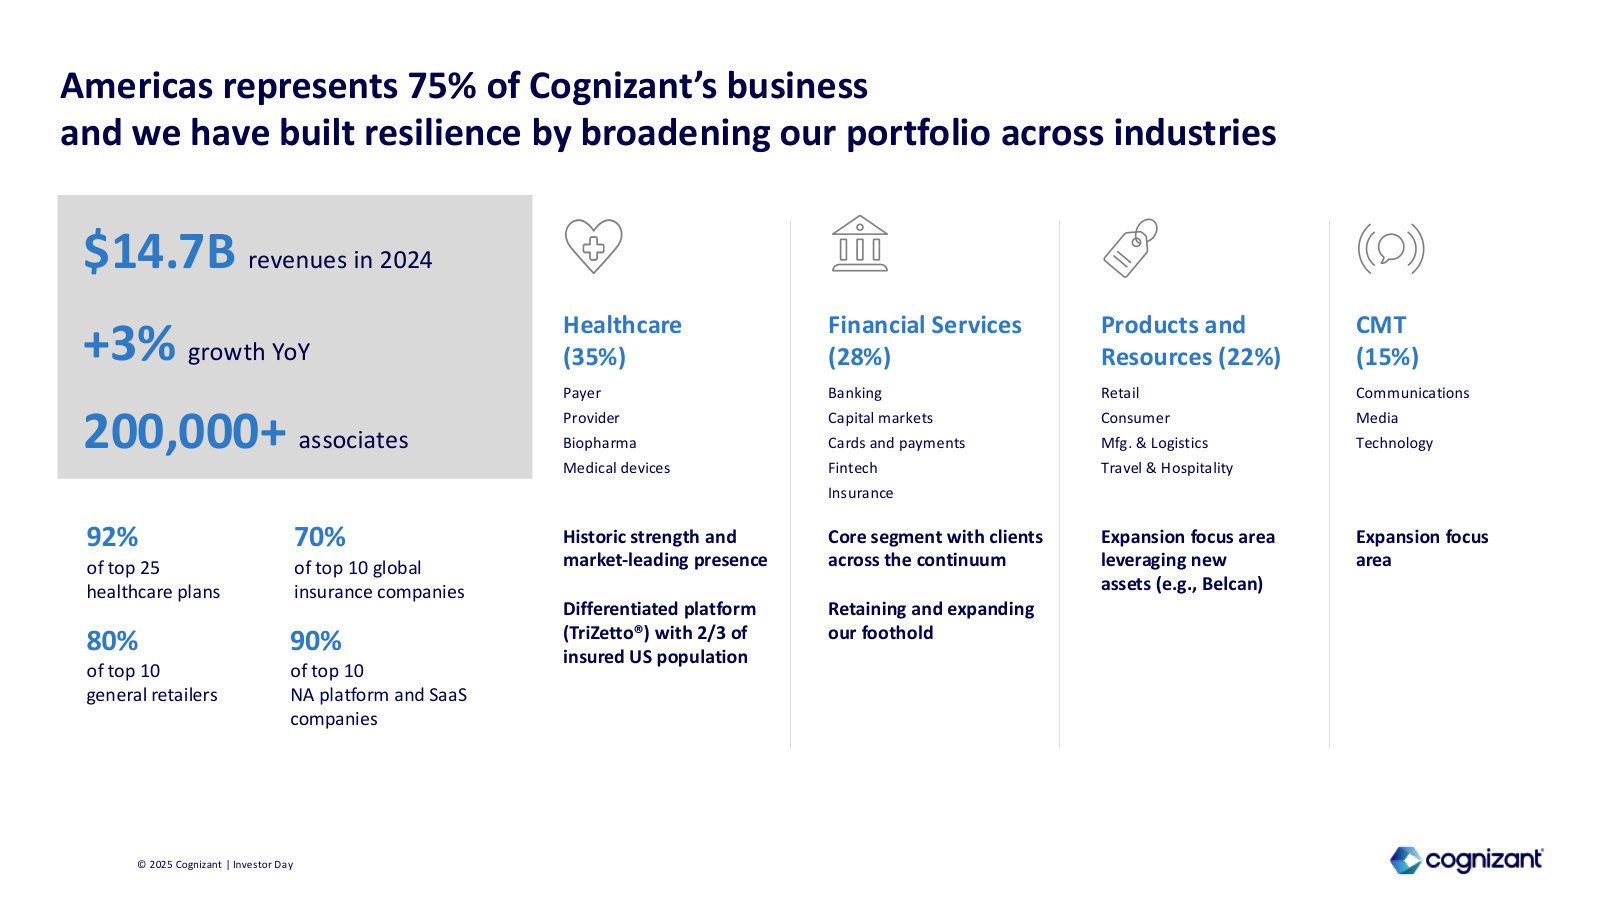
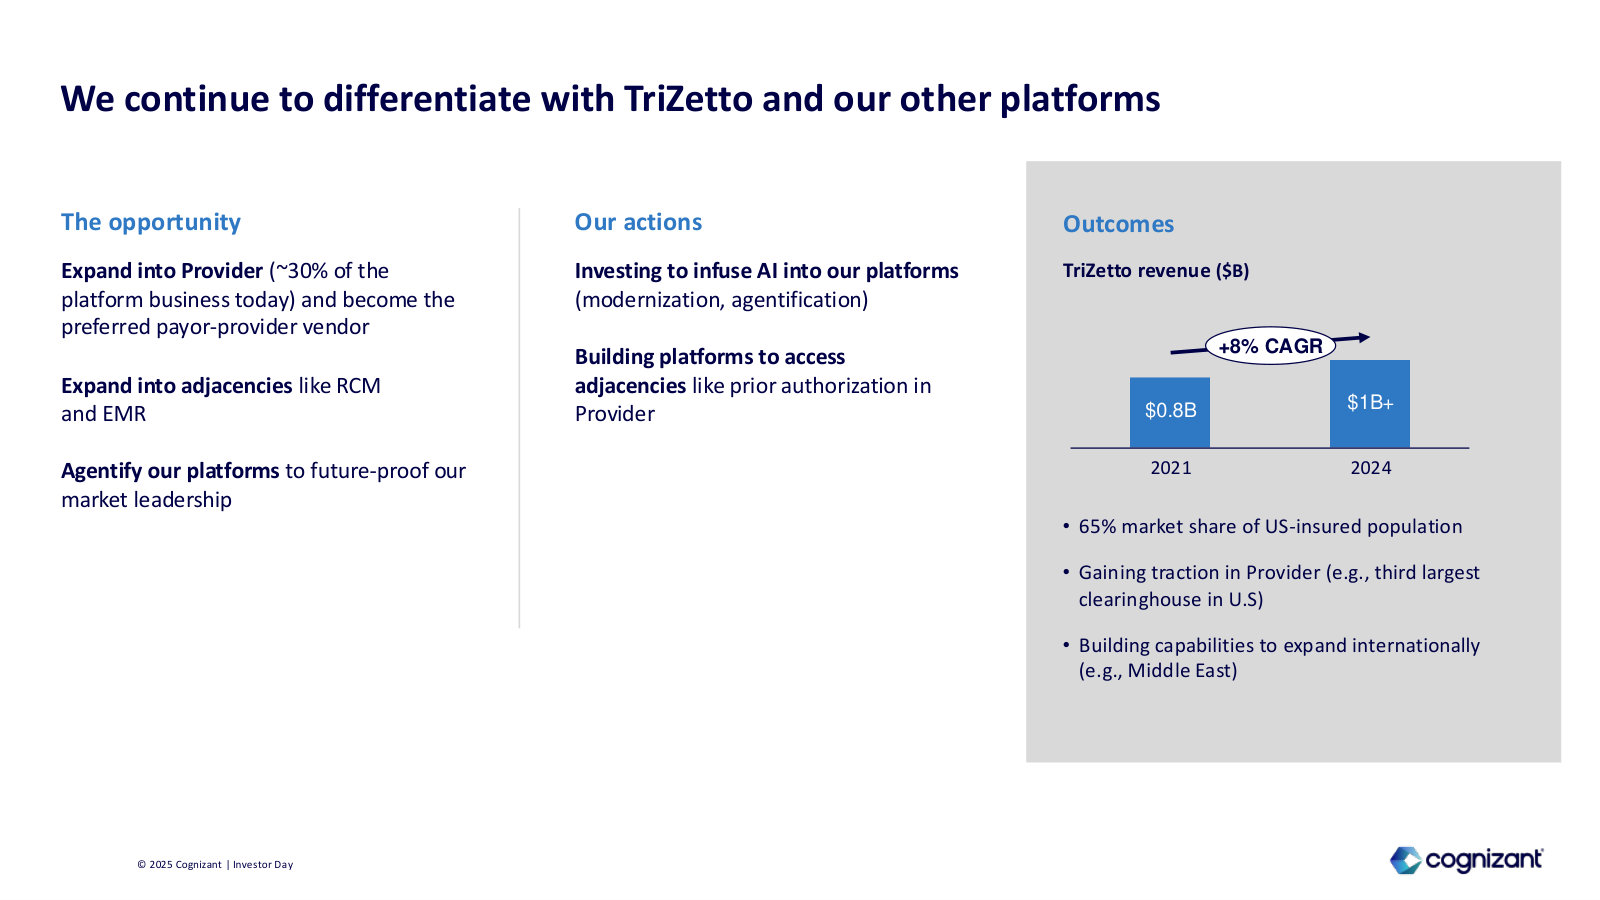
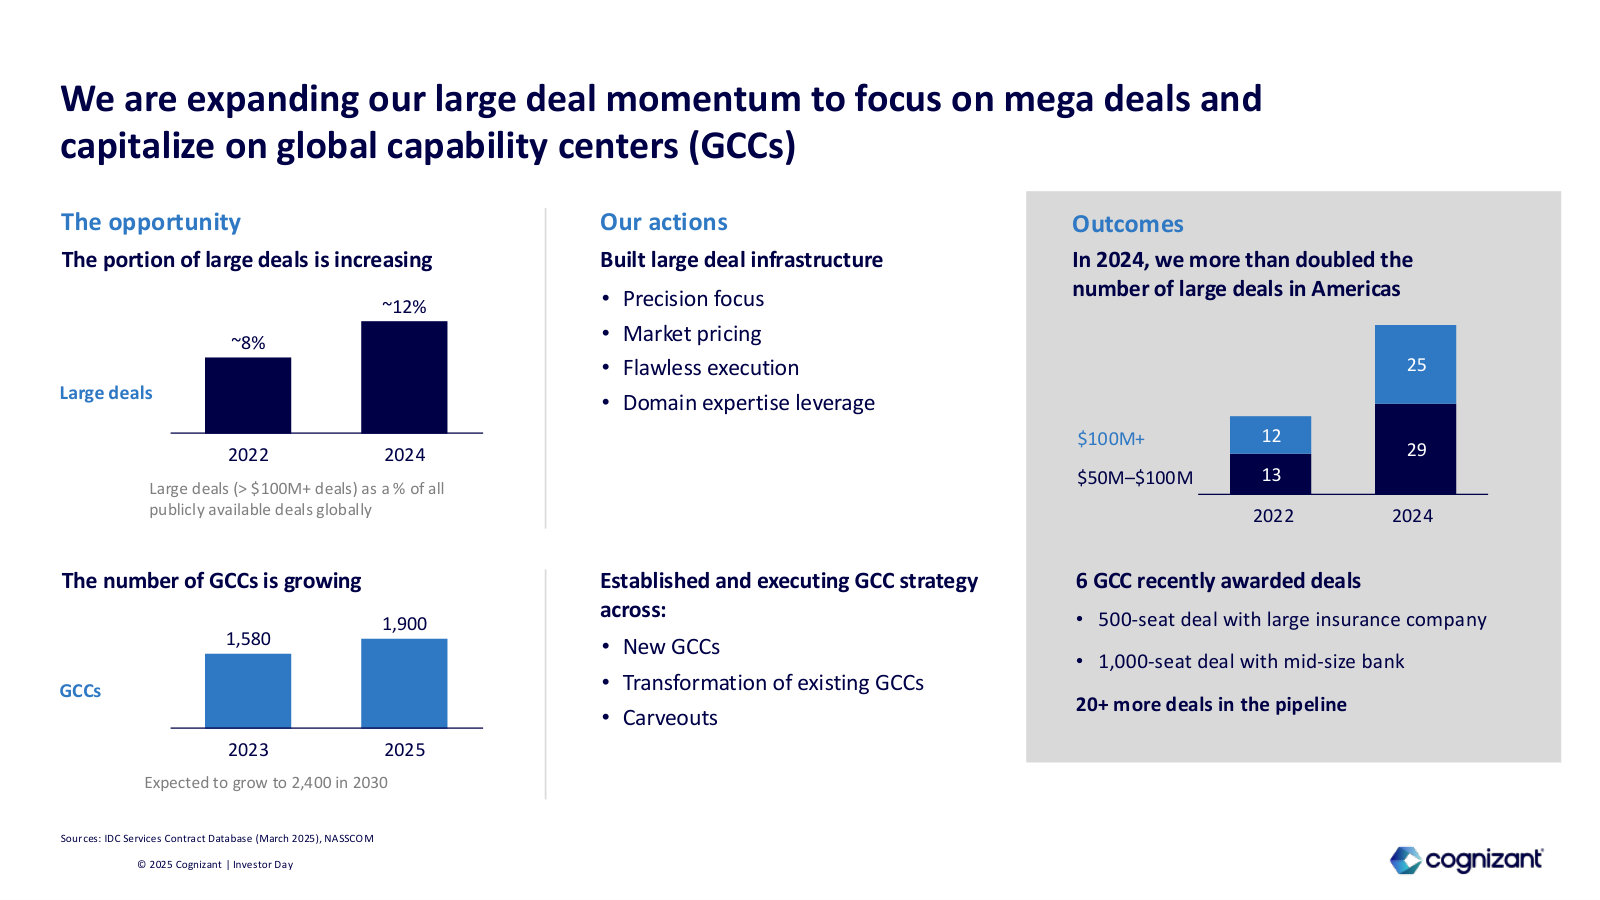
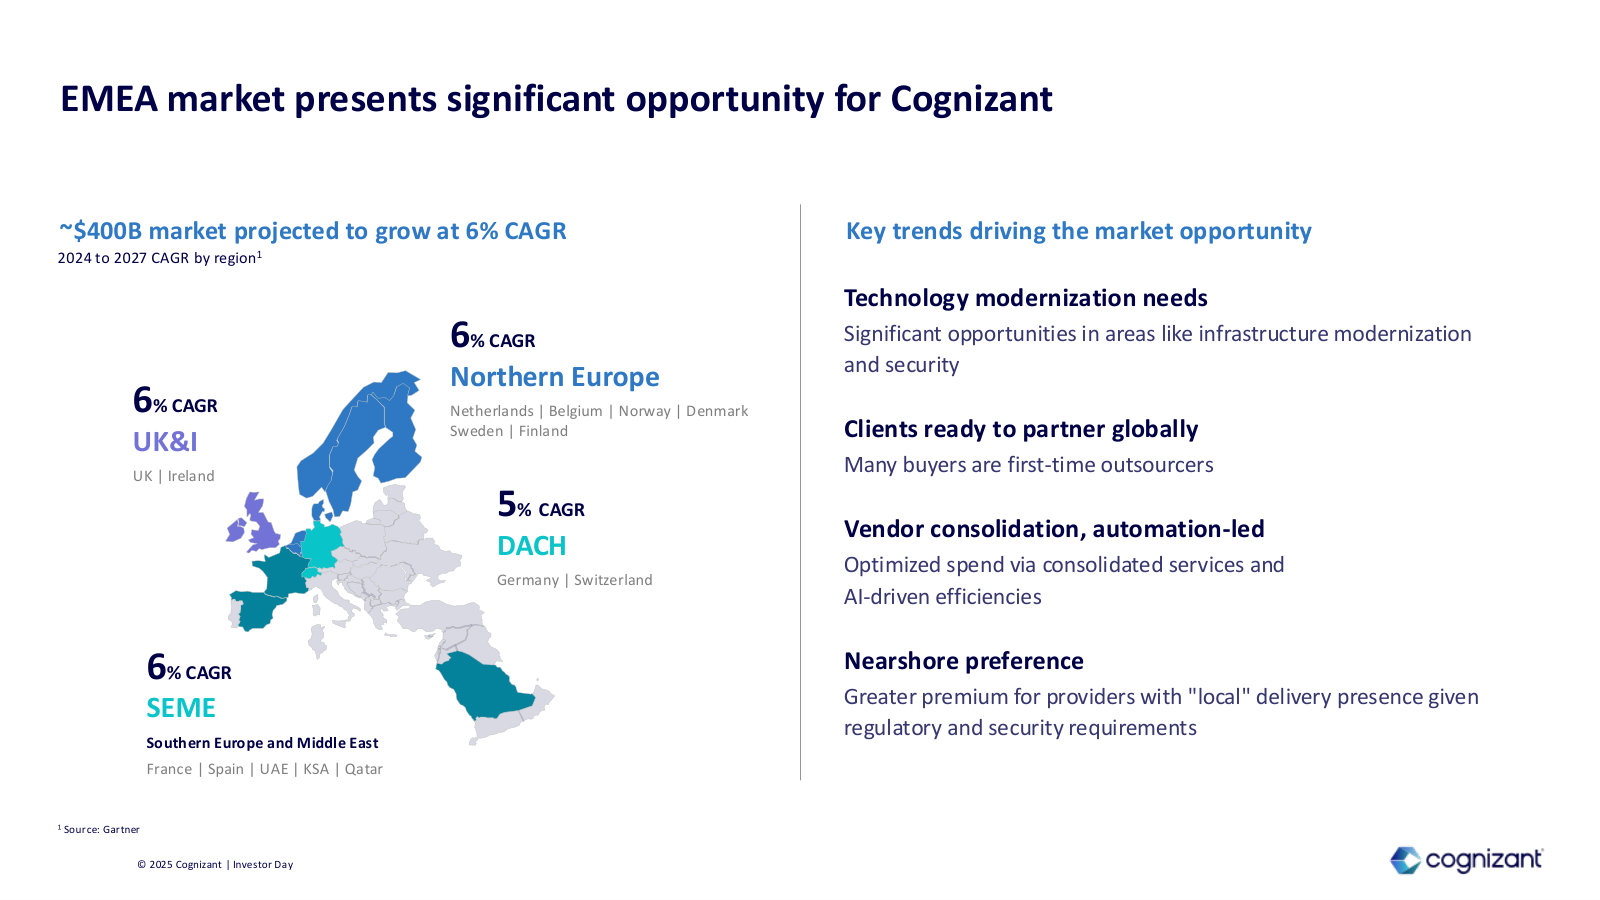
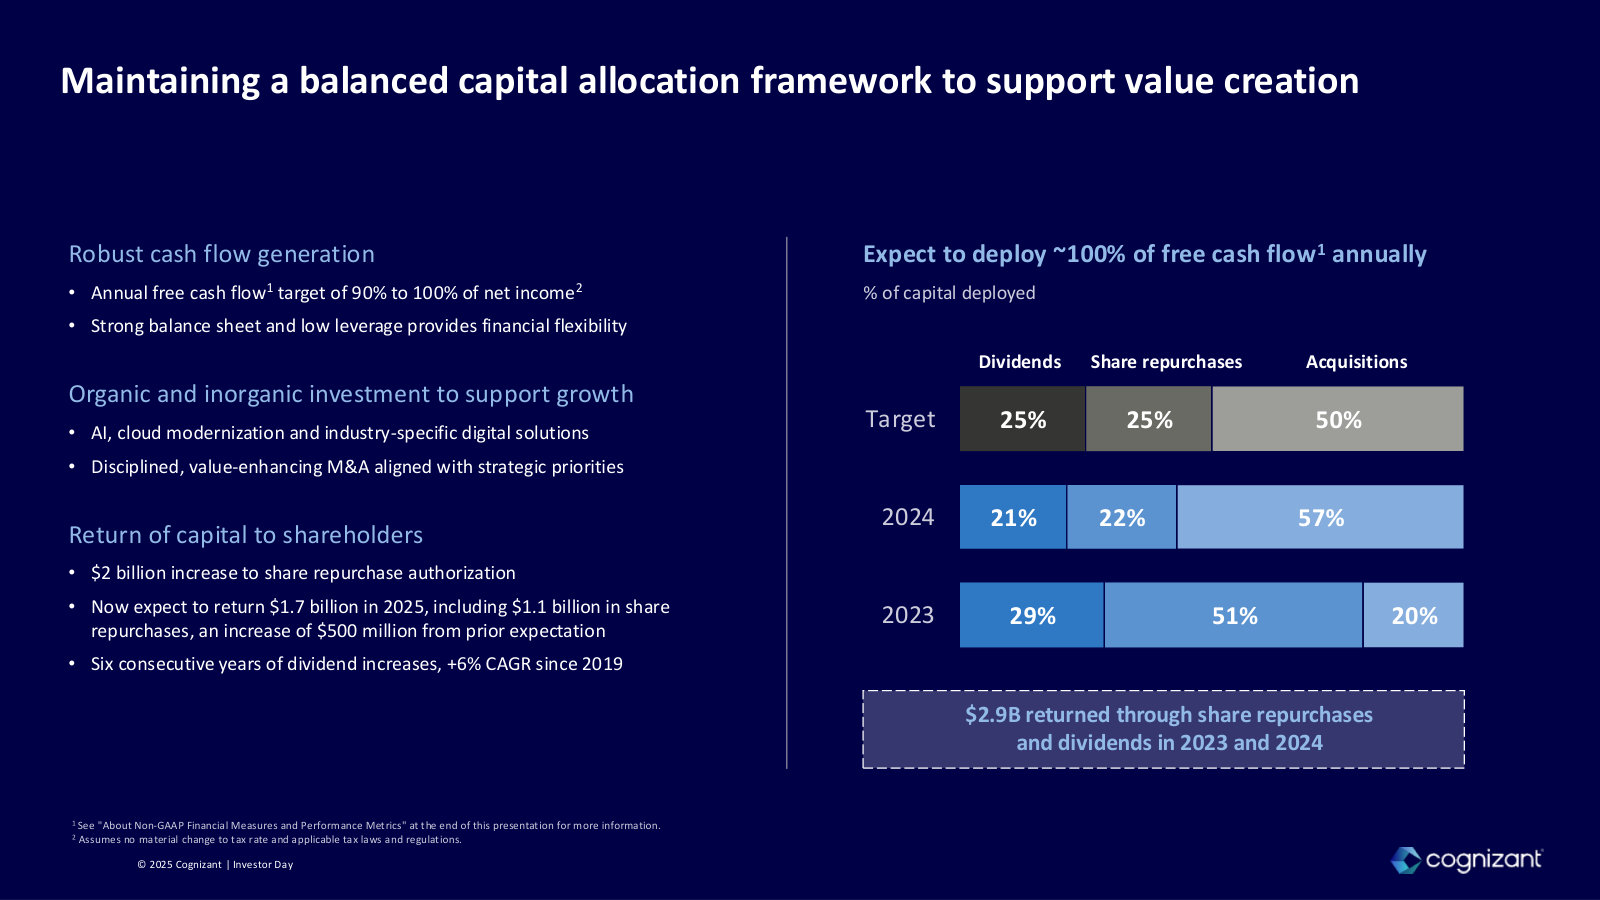
Management's fullest statement of what Cognizant does, how it makes money and its 2027 plan — market sizing, segments, the AI strategy and financial targets. · Open the full document →
Q4 & Full-Year 2025 Earnings Presentation — Q4 / FY2025
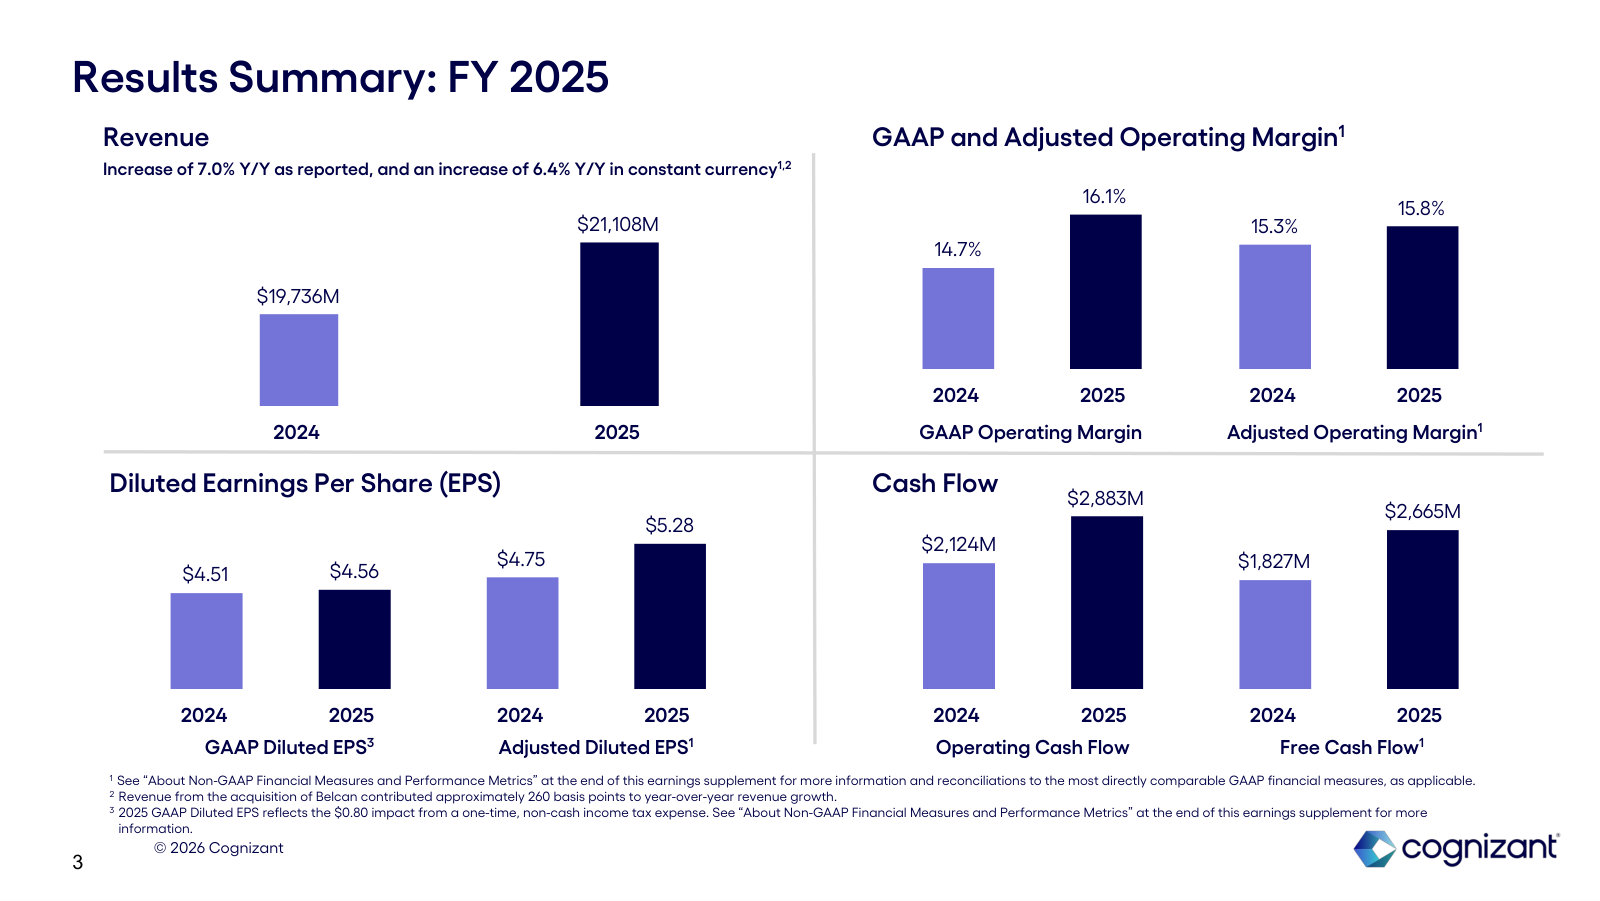
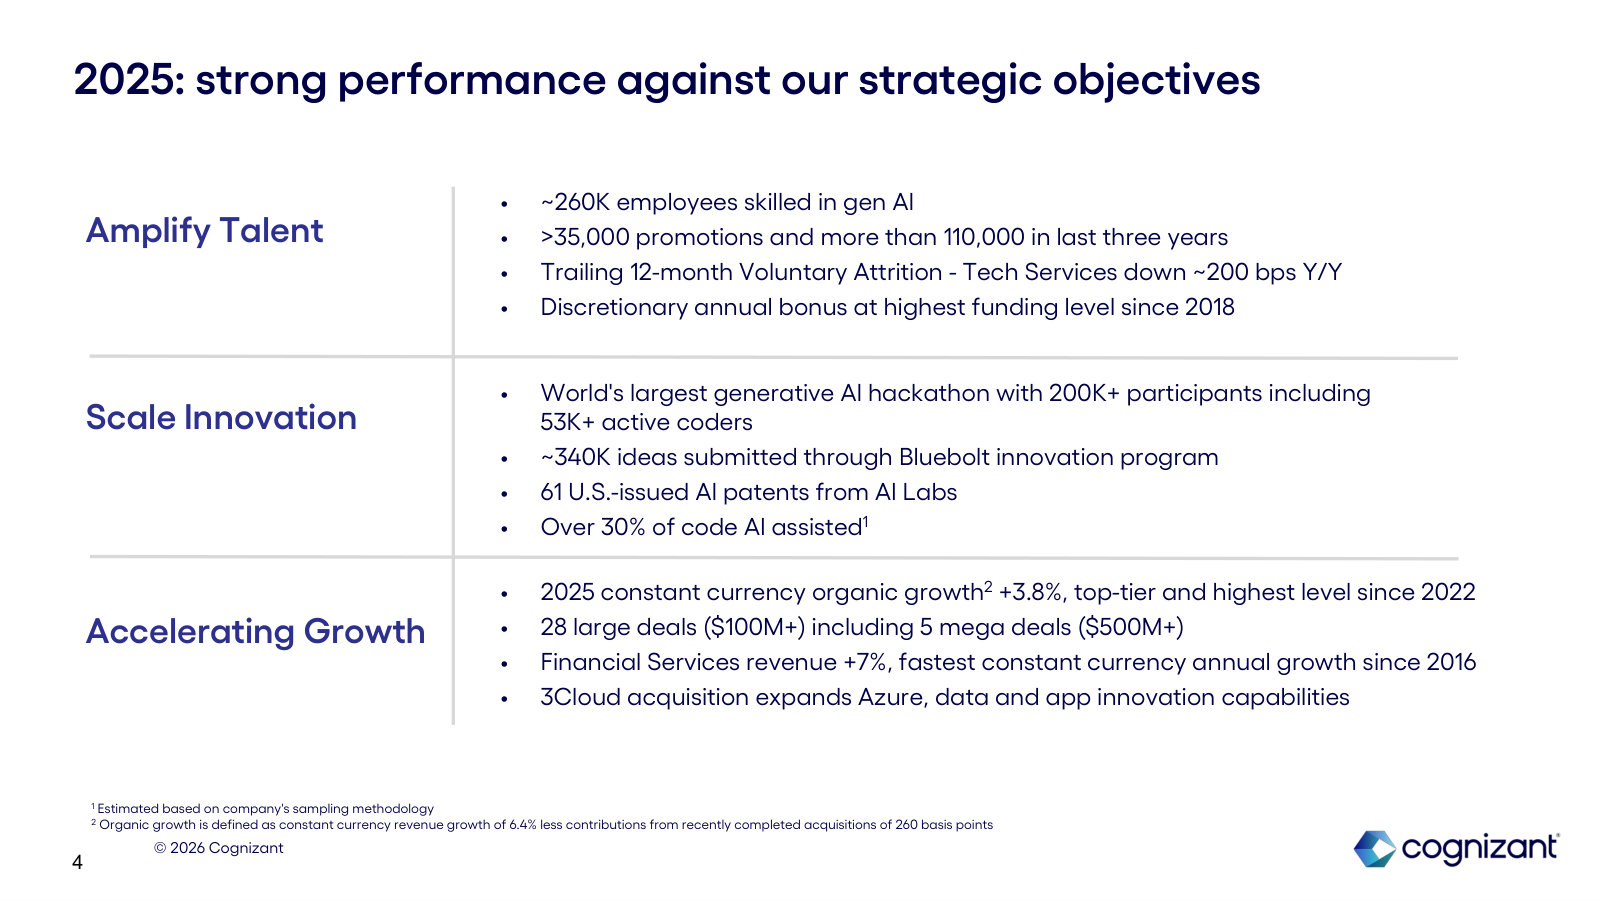
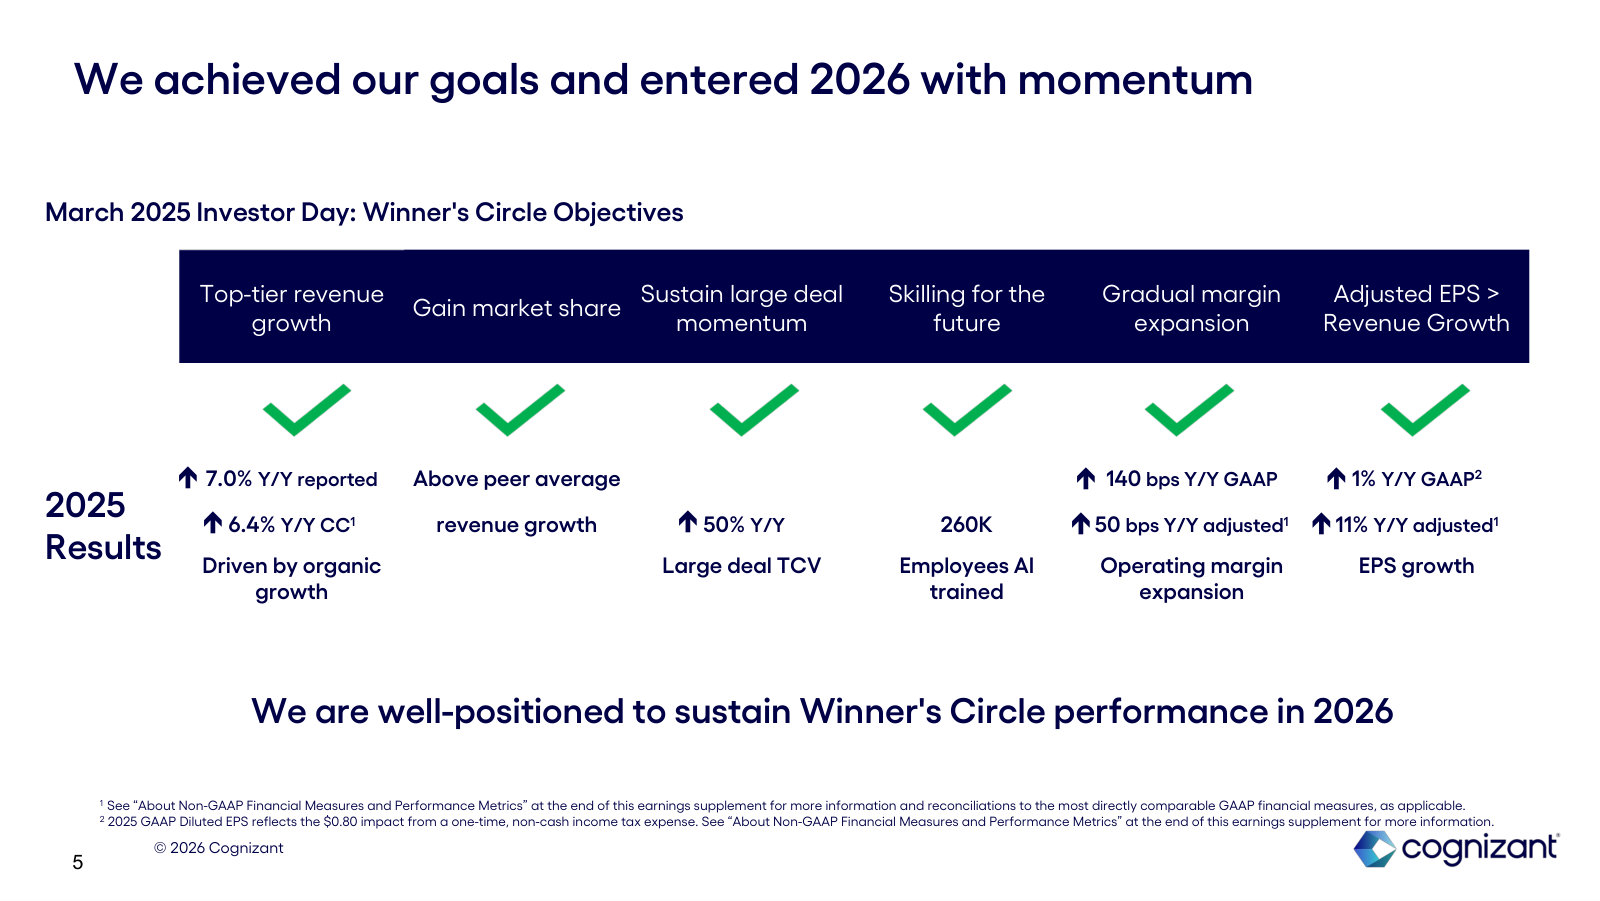
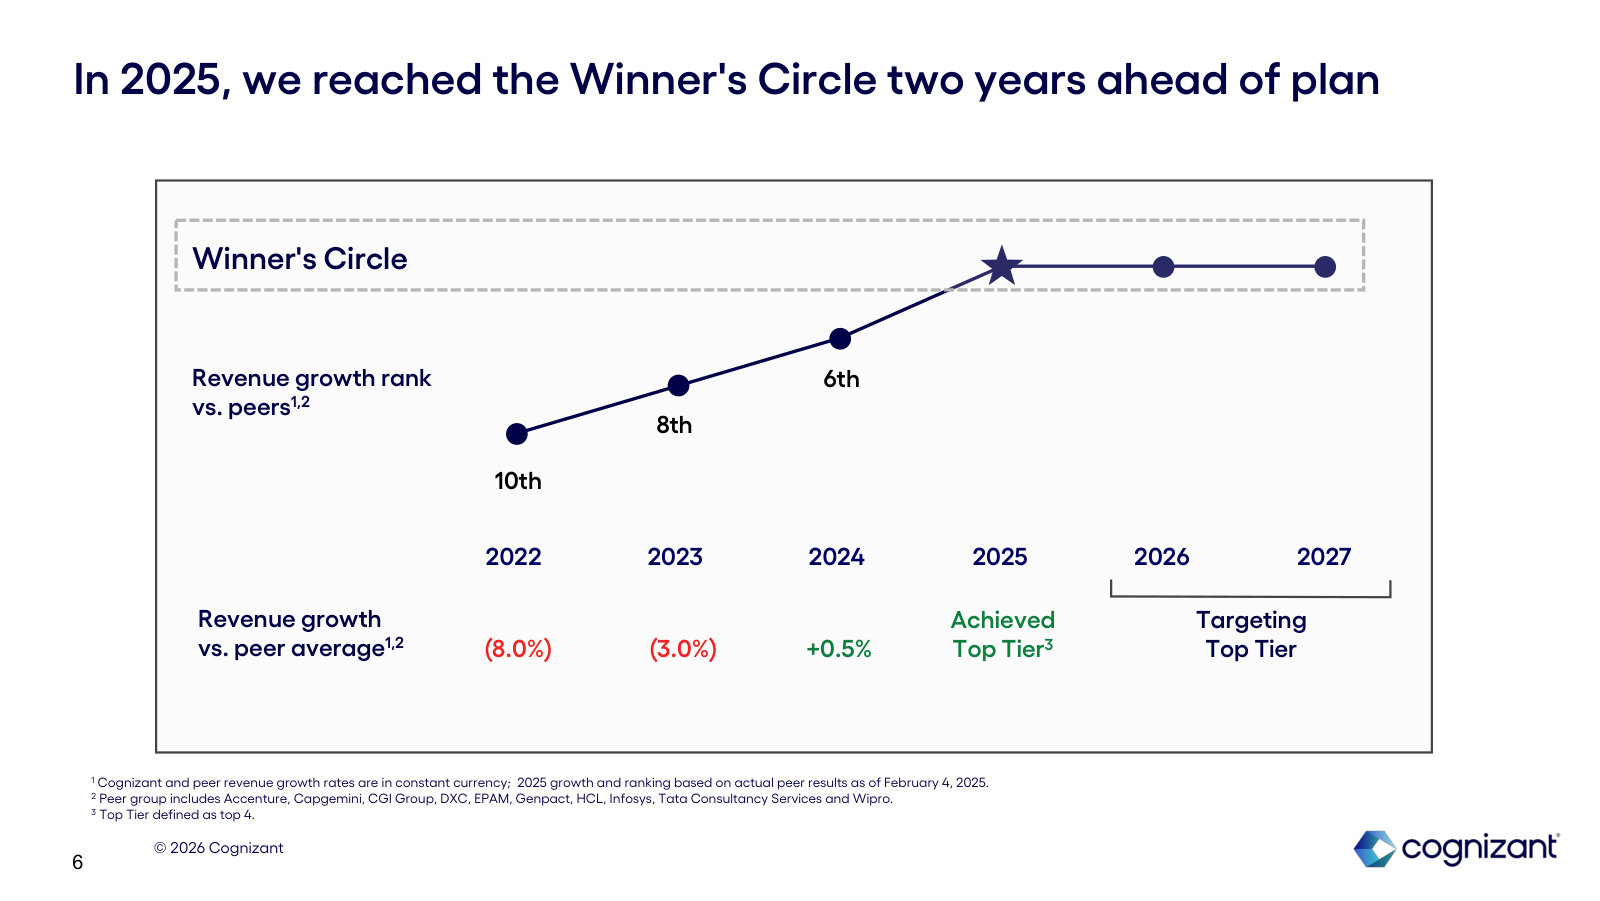
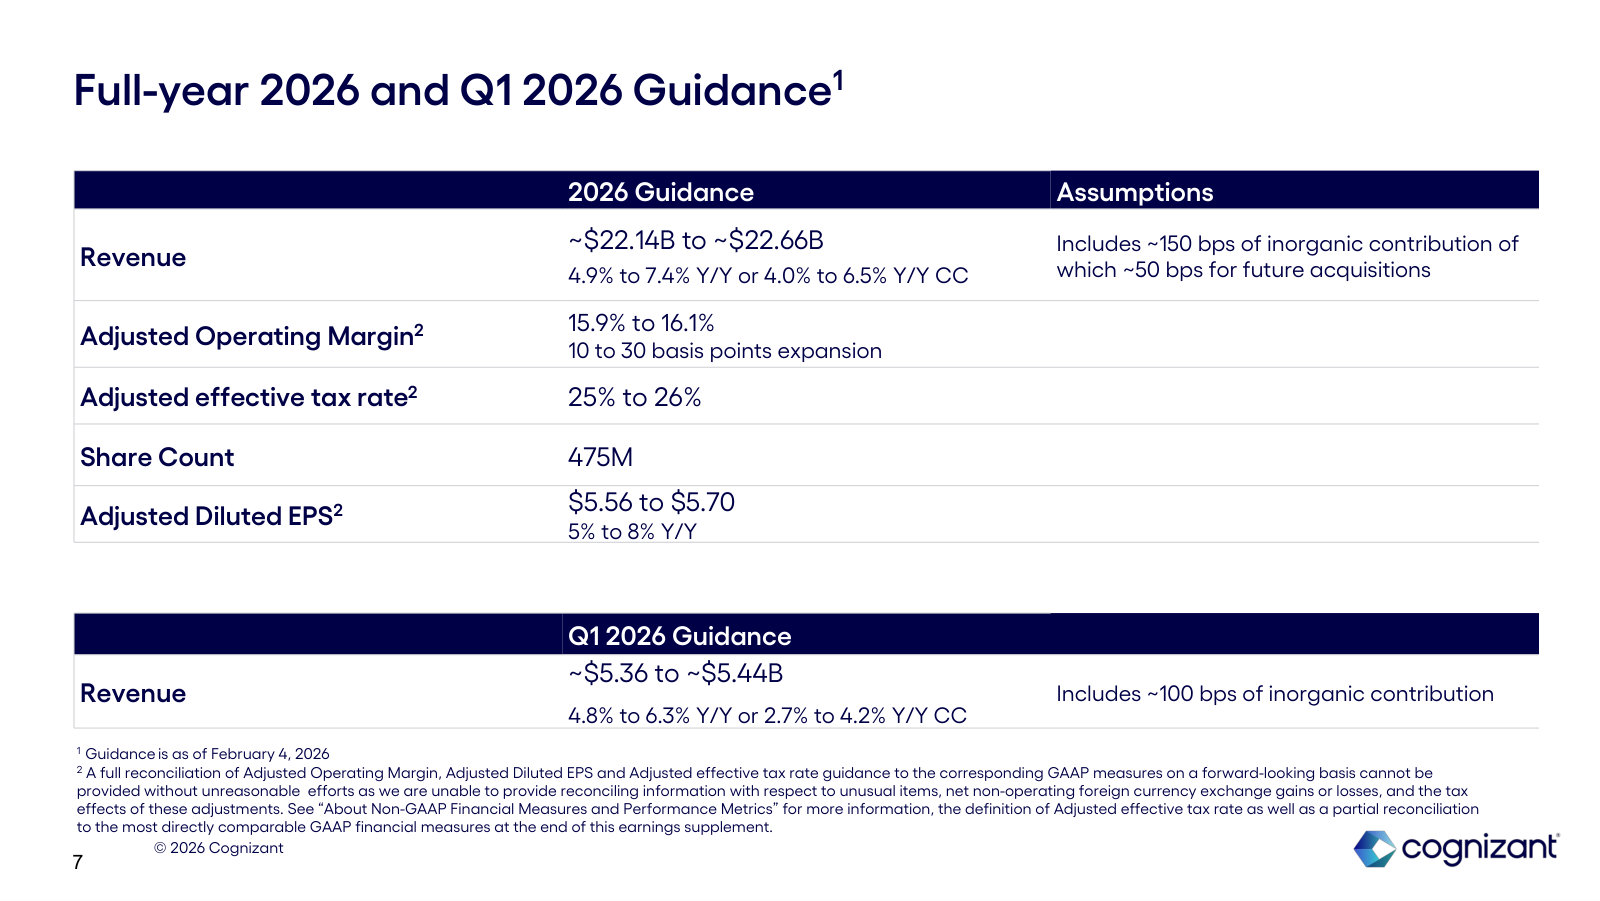
The latest full-year results and guidance, plus the scorecard that closes the loop on the March 2025 Investor Day targets. · Open the full document →
More from management
Q1 2026 Earnings Presentation — Q1 2026 · 19 pages · The latest quarterly numbers and updated 2026 guidance, in the same earnings-supplement format. · Open →
Q4 & Full-Year 2024 Earnings Presentation — Q4 / FY2024 · 20 pages · The full-year 2024 baseline — the pre-Winner's-Circle starting point the recovery is measured from. · Open →
Cognizant Technology Solutions Corporation's management answers for the business every quarter. These are the exchanges that explain it best — verbatim, from the call transcripts preserved in Sources. Each link opens the full transcript at that page in a new tab.
Q1 FY2026 Earnings Call — Q1 FY2026
The fullest account of the AI-builder economics: token-metered rate cards, Project LEAP, and how pricing is shifting from labor to outcomes. · Open the full transcript →
The strategic reframe: from systems integrator to AI builder, and why AI forces it.
Ravi Kumar (Chief Executive Officer): With AI, the fundamentals are shifting. Software is penetrating deeper into enterprises and our clients now expect more value and measurable outcomes. The old fundamentals are still relevant, but there must be a reforge for a new reality. Cognizant has already embarked on this transition, which demands four significant shifts that redefine the role of IT services firms. First, we are evolving towards owning the full stack of capabilities required to design holistic bespoke AI systems from a systems integrator to an AI builder.
p. 1 · Read in context →
On AI price pressure the game shifts from unit price to how few units deliver the same outcome.
Ravi Kumar (CEO); question from Jason Kupferberg (Wells Fargo): The way I see it is, unlike in the past, where pricing was determined by the unit price, which is billing equivalent, the race now is about the number of units and how well you can deliver with a lower number of units for the same output and the same outcome. That is based on how much productivity you can derive out of AI usage in your software development cycle. So we feel very confident because 40% of our software development cycle is assisted by AI. We have infused AI into our rate cards. So when we are up for a consolidation opportunity, we seem to be in the winner's spot because we are able to share the productivity and also keep some for ourselves.
p. 7 · Read in context →
How AI-era pricing works: token metering and an A0 to A3 human-to-autonomous rate card.
Ravi Kumar (CEO); question from James Schneider (Goldman Sachs): Token metering is a reality, both at a project level and at an individual level. We have token metering for fixed-price programs as well as for time-and-materials. For fixed-price programs, we have the opportunity to reduce the cost and keep the margin with us. For new deals, we actually have the opportunity to outpace the productivity we give to our clients and therefore keep some of that benefit. […] On time-and-materials and tokenized rate cards, we are starting to see a pattern. I'll give you an example of a rate card template we're taking to the market: A0 is completely human effort; A1 is effort done by humans verified by AI; A2 is effort delivered by AI, verified by humans; A3 is autonomous digital labor. […] But clients have started to see that they are not able to optimize the digital effort themselves, so some clients are coming back and asking us to take care of both the human and digital effort. They want us to open the tap on compute, manage the model usage, and deliver the service end to end so they don't have to manage the economics.
p. 8 · Read in context →
Capital allocation: strong free cash flow, ~$2B returned, and fuel in the tank for AI-aligned M&A.
Jatin Dalal (Chief Financial Officer); question from James Faucette (Morgan Stanley): And just from a capital allocation standpoint, we generated $2.5 billion of free cash flow last year. We returned close to $2 billion to shareholders and roughly $500 million to $700 million was invested into three-cloud acquisitions, which technically closed at the beginning of this year but were announced in 2025. This year, again, we generated strong free cash flow. We have committed $1.6 billion to be returned to shareholders — $1 billion via share buyback and $600 million in dividends. Of that, we have now used about $600 million for the repurchase so far. We therefore have fuel in the tank and a very healthy balance sheet to leverage for attractive opportunities. We'll remain disciplined, but we have the capacity to act on the right opportunities.
p. 9 · Read in context →
Project LEAP: resizing the pyramid with early-career talent and funding the shift to outcome-based models.
Ravi Kumar (CEO); question from Tien-Tsin Huang (JPMorgan): We have a clear frame of what our future operating model looks like, and Project LEAP is designed to get us there faster. It's our opportunity to resize our pyramid with a broader base — that's why we're hiring more early-career talent and shortening the path to expertise. This model is margin-accretive because the more we broaden the pyramid with AI-native skills, the more services we can deliver efficiently. Second, it allows us to invest in platforms, AI enablement, tokenization and automation. We have measured the savings: in 2026, we expect $200 million to $300 million in savings, recognizing that this year is partial since we're already mid-year; the full impact is larger in 2027. So not only are we right-sizing the pyramid, but we are also accelerating our move to outcome-based models.
p. 10 · Read in context →
Q4 & Full-Year 2025 Earnings Call — Q4 FY2025
The victory-lap annual call: winner's-circle reached two years early, plus the clearest explanation of why AI is a tailwind for services and BPO. · Open the full transcript →
Three eras of IT services and why AI lets Cognizant own the stack again.
Ravi Kumar (CEO): In the nineties, we were bespoke systems builders. We wrote custom software code, and we owned the outcomes. In the two decades that followed, our role evolved into orchestrating classical software owned by various software providers. But classical software was written around the microprocessor, was deterministic, and built on rigid logic and fixed rules. Today's AI-led software, which is written around the frontier models, is probabilistic and contextual. This shift allows us to own the stack again and deliver outcomes.
p. 2 · Read in context →
The bear case answered: AI does not self-deploy; enterprises need a bridge, and that is the business.
Ravi Kumar (CEO); question from Jason Kupferberg (Wells Fargo): this has happened over tech revolutions before. When a new technology comes, we kind of think the old technology will go away, but the new technology will actually provide more opportunities. I see this as an increase in our total addressable spend. […] any tool, any technology will not magically generate value on the other side. You need a bridge. And that bridge is what companies like Cognizant do.
p. 6 · Read in context →
Fixed-price economics: Cognizant underwrites the productivity and carries the delivery risk.
Jatin Dalal (CFO); question from Keith Bachman (BMO Capital Markets): there are various types of fixed price engagements, but essentially, I mean, they have one thing in common is that the larger component of delivery risk resides with the service providers like us. And, essentially, we underwrite the productivity in the beginning of the contract and we deliver to that productivity to the customer irrespective of whether we are able to achieve that outcome from a cost standpoint or not. […] we deliver on aggregate of the portfolio very close to the expected margins that we had planned, which means we are in aggregate not having any overrun or also not significant underrun.
p. 9 · Read in context →
Q4 & Full-Year 2024 Earnings Call — Q4 FY2024
The pivot-to-growth call where the three-vector AI framework and the TriZetto/Belcan portfolio were first laid out in full. · Open the full transcript →
TriZetto, the healthcare moat: a platform that processes about two-thirds of US healthcare claims.
Ravi Kumar (CEO): This included continued strength in TriZetto, our differentiated software platform that is used to process about two-thirds of US healthcare claims. As a recent example, we entered an agreement in 2024 to enhance healthcare operations for Blue Shield of California with our TriZetto Facets platform as a service solution.
p. 2 · Read in context →
The three-vector AI strategy laid out: productivity, integration, and software as the worker itself.
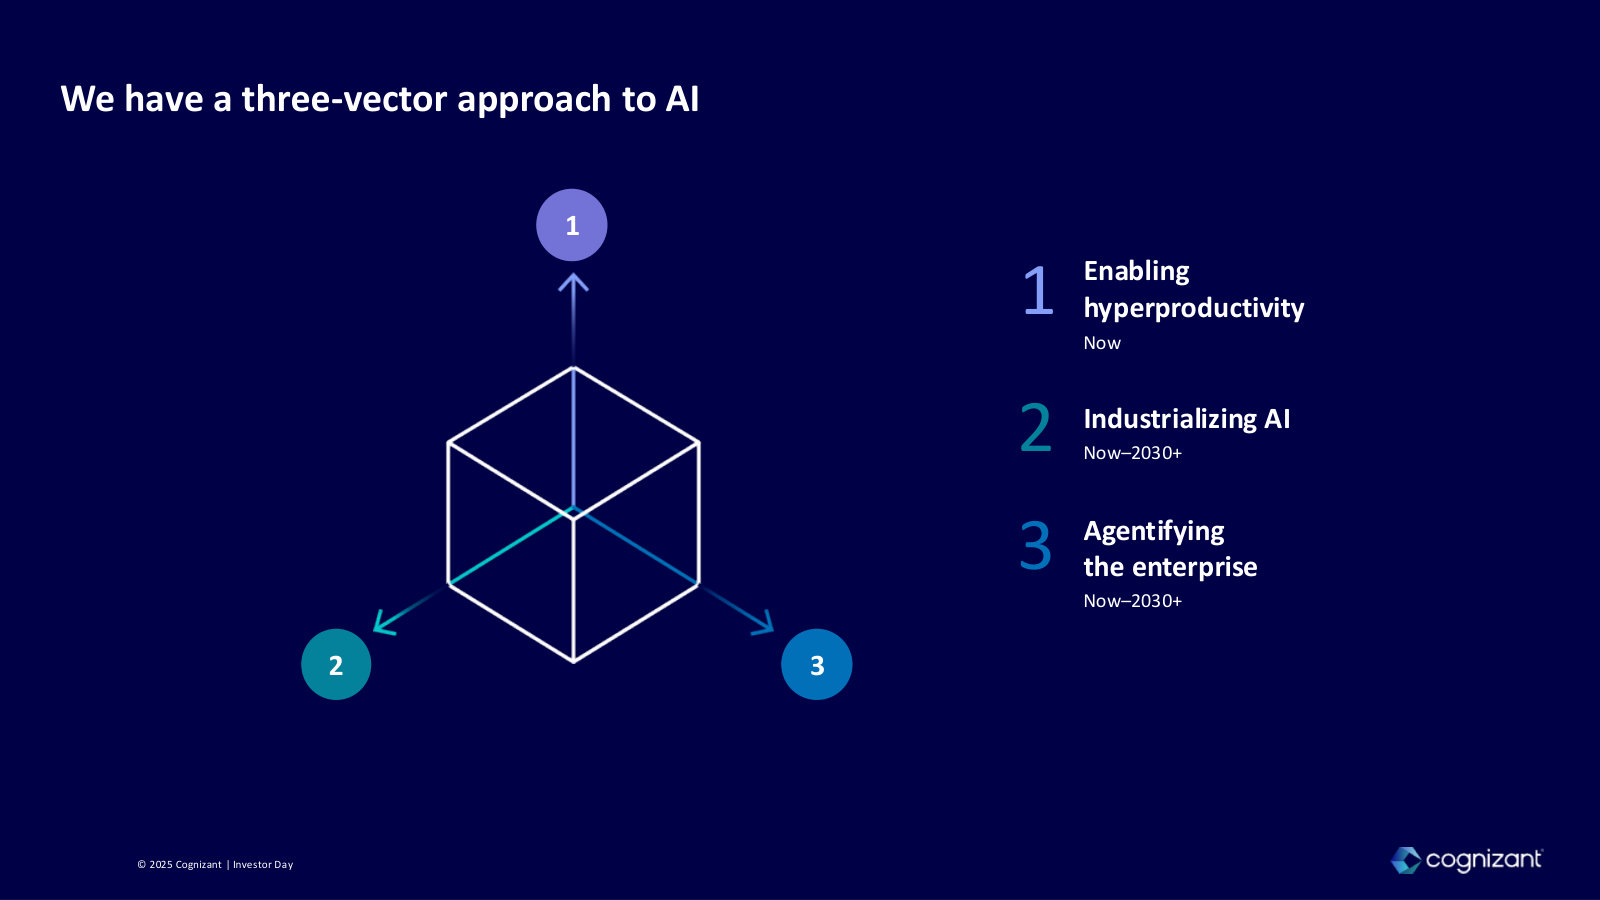
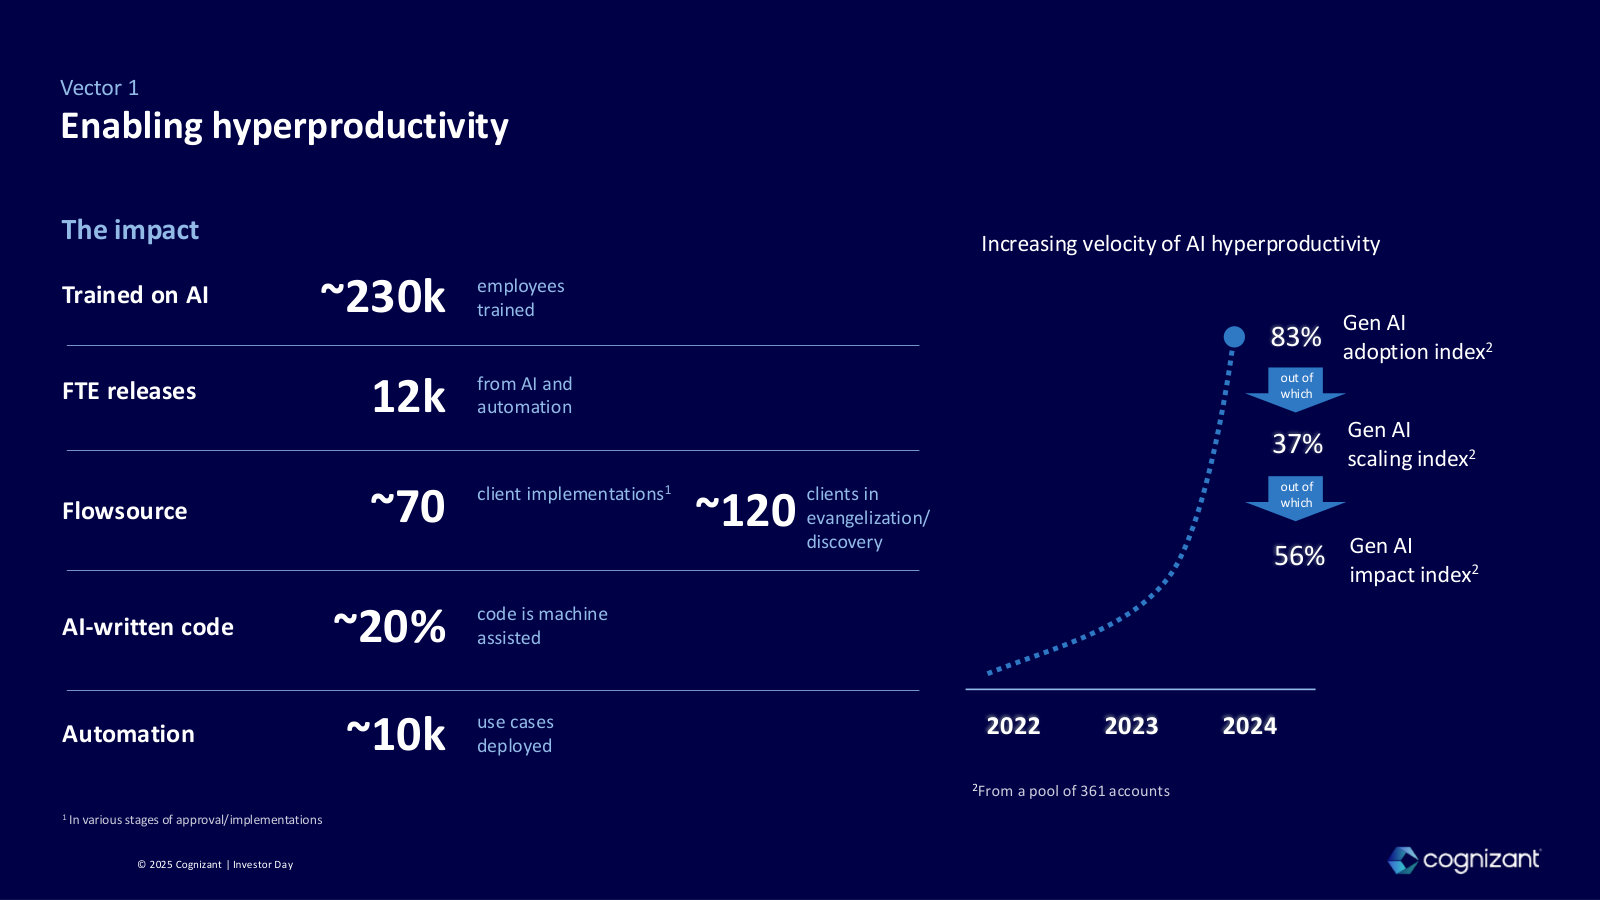
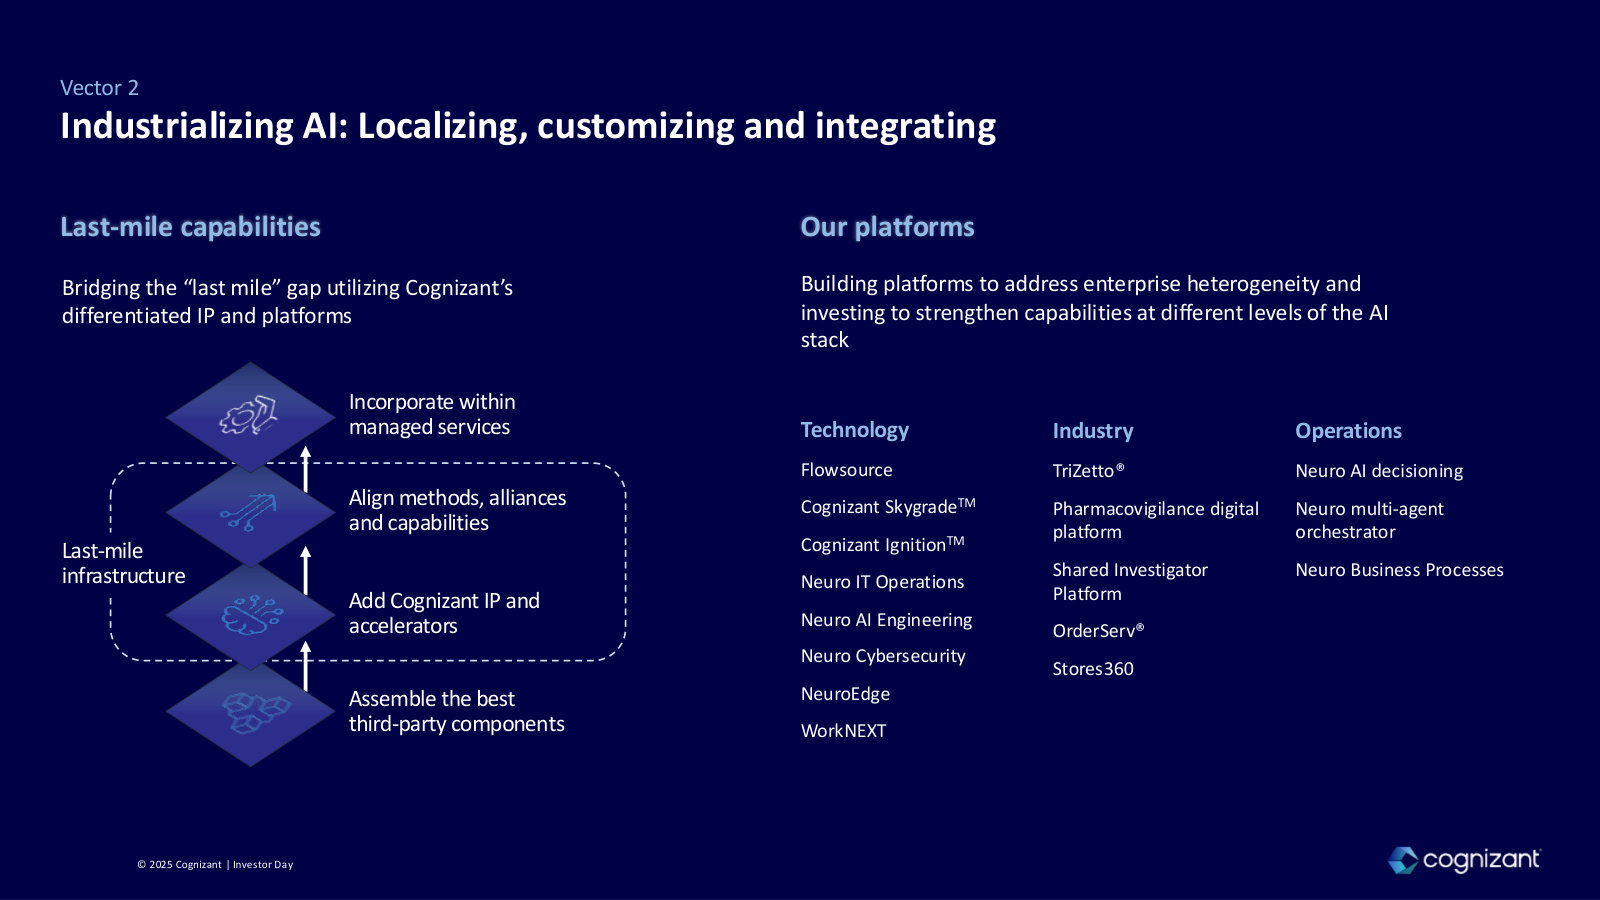
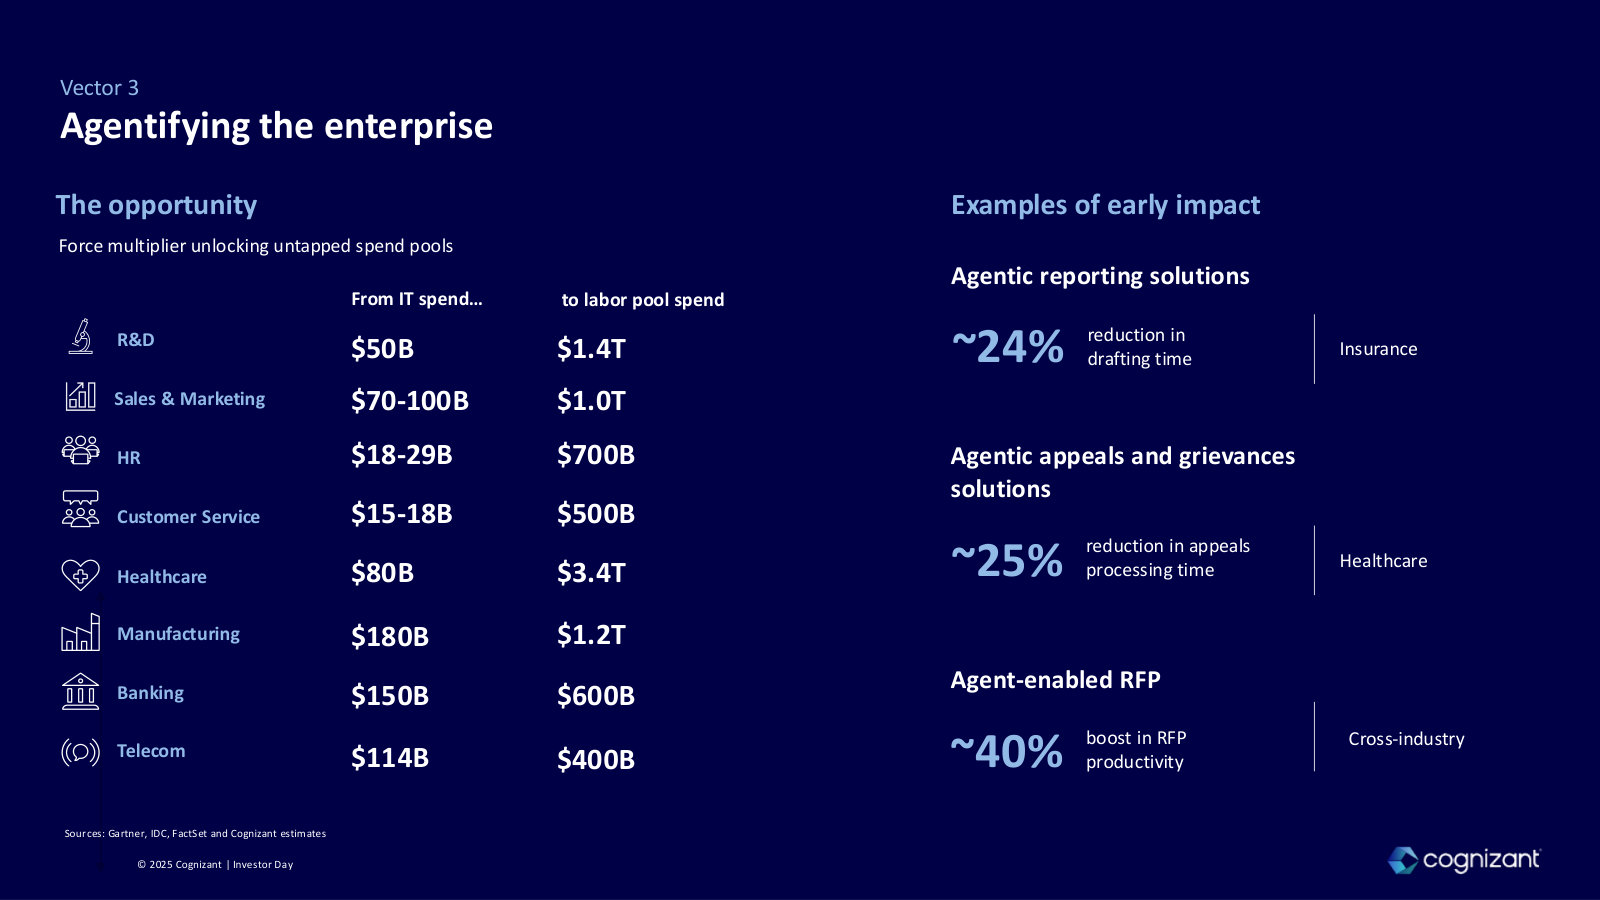
Ravi Kumar (CEO): We see the AI-enabled opportunity playing out in three distinct vectors with the first already here. First, the most mainstream use case of AI is tech for tech for its application in software development cycles with the help of code assist platforms. […] In the fourth quarter, we estimated that 20% of our code accepted by developers was generated by AI, allowing us to do more for less and unleash a wave of hyper productivity. […] The Vector 2 opportunity will be about modernizing the data and cloud foundation for integrating AI into enterprise landscapes. […] Finally, Vector 3 is about untapped and newer service pools that we believe will be unlocked by agentification. Our view is that, software may no longer be mainly a tool for organizing work, but can become the worker itself, capable of understanding, executing, and improving services traditionally delivered by humans.
p. 2 · Read in context →
Is the software edge defensible? Ravi on fast software, Flowsource, and staying ahead of replication.
Ravi Kumar (CEO); question from Surinder Thind (Jefferies): The software layer we've developed, which I refer to as fast software, provides essential tools for our clients to accelerate their progress, bridge gaps, or create micro industry vertical templates that existing software lacks. […] For instance, our platform Flowsource acts as an orchestration layer over code assist platforms like GitHub. We created this layer because we recognized the need for a developer workbench that can synchronize the efforts of machine-written code and human-written code to enhance productivity. […] While some existing platforms may eventually replicate this functionality, by that time, we will be tackling more complex challenges. The gaps we face today will persist, and it will be the responsibility of system integrators to address those, with some eventually becoming products.
p. 8 · Read in context →
Q2 2023 Earnings Call — Q2 FY2023
Ravi Kumar seven months in: the turnaround plan, the $1B GenAI bet, and the bookings-to-revenue puzzle at the start of the story. · Open the full transcript →
The turnaround plan at inception: accelerate growth and a $1 billion, three-year bet on generative AI.
Ravi Kumar (CEO): Our next priority is to accelerate revenue growth which is the absolute focus of the entire management team. We are differentiating Cognizant and large-deal opportunities by scaling our capabilities for cost take-out and optimization and focusing more on managed services. […] Given the groundswell of interest in generative AI, the number of projects we have underway focused on cognitive and generative AI, we see this technology generating a new wave of opportunities for us. Accordingly we expect to invest approximately $1 billion in our generative AI capabilities over the next three years.
p. 6 · Read in context →
The two swim lanes framing of demand: transformation vs. cost-takeout, then skewed to cost.
Ravi Kumar (CEO); question from Ashwin Shirvaikar (Citi): there are two swim lanes on large deals. One is related to transformation. One is related to efficiencies, productivity, cost takeout. I think it’s fair to say that at this point of time the deals we are seeing in the market are over-indexed to efficiency, cost takeout, consolidation kind of deals.
p. 11 · Read in context →
Why record bookings were not converting: longer-duration, larger deals push revenue out.
Jan Siegmund (Chief Financial Officer); question from Ashwin Shirvaikar (Citi): the duration of the deals that we signed up in the last year has very meaningfully lengthened, basically. So we have been signing up longer-term deals, on average, with a higher deal value. […] the actual contribution of this book in volume just to give you an example for the rest of year revenue is actually lower than it was in the comparable quarter. So we really have built a pipeline for longer type of revenue streams in the future, which obviously gives us good comfort into the quality of revenue stream going forward, but it also explains why and we’re not seeing immediate uptake on our revenues as these bookings will take time to translate into revenue.
p. 12 · Read in context →
More calls
Q3 2025 Earnings Call — Q3 FY2025 · 12 pages · The last quarter before the winner's-circle declaration: continued beat-and-raise, financial-services strength and building large-deal momentum. · Open →
Q2 2025 Earnings Call — Q2 FY2025 · 13 pages · A mid-2025 read on the recovery in discretionary spending and how the large-deal book was converting into growth. · Open →
Q1 2025 Earnings Call — Q1 FY2025 · 11 pages · The first call after the March 2025 Investor Day, where management framed its 2027 winner's-circle target and margin roadmap. · Open →
Q3 2024 Earnings Call — Q3 FY2024 · 12 pages · The first quarter with the Belcan engineering (ER&D) acquisition consolidated, reshaping the Products & Resources portfolio. · Open →
Q4 & Full-Year 2023 Earnings Call — Q4 FY2023 · 21 pages · Ravi Kumar's first full-year results as CEO: the stabilization year and the NextGen cost program that funded the later pivot to growth. · Open →
Cognizant Technology Solutions Corporation's annual reports contain management's most considered account of the business. These are the sections, passages and visual pages worth opening in the originals preserved in Sources.
Cognizant Technology Solutions Corporation — FY2025 Annual Report (Form 10-K) — FY2025 (year ended December 31, 2025)
Latest 10-K: management's fullest account of the pivot to an 'AI builder', the four industry segments, and how AI is both the growth engine and the biggest threat. · Open the full document →
Item 1. Business — Overview — p. 11 · Read the full section →
States who Cognizant now is: a professional-services firm repositioned as an 'AI builder' at the intersection of industry and technology.
Cognizant recast as an 'AI builder' — the opening identity statement of the 10-K.
Cognizant is one of the world’s leading professional services companies, engineering modern businesses and delivering strategic outcomes for our clients. We help clients modernize technology, reimagine processes and transform experiences so they can stay ahead in today's fast-changing world, where AI is reshaping organizations in every field. As an AI builder, we provide deep expertise at the intersection of industry and technology, combining our perspective with extensive knowledge of our clients' organizations to build industry-specific platforms and incorporate context into systems, AI models and custom solutions. We tailor our services and solutions to specific industries with an integrated global delivery model that employs client service and delivery teams based at client locations and dedicated global and regional delivery centers. Our services include consulting, application development, systems integration, quality engineering and assurance, engineering research and development, application maintenance, infrastructure and security as well as business process services and automation.
p. 11 · Read in context →
Reportable Business Segments — p. 13 · Read the full section →
Shows how demand differs across the four segments — Health Sciences and Financial Services are the clearest windows into what clients are buying.
What drives demand in Health Sciences and Financial Services — modernization, regulation and enterprise AI adoption.
Our HS segment consists of healthcare providers and payers, and life sciences companies, including pharmaceutical, biotech and medical device companies. Demand in this segment is driven by emerging industry trends, including the shift towards consumerism, outcome-based care, digital health and delivering seamless, patient-centered experiences. These trends result in increased demand for services that drive operational improvements in areas such as clinical development, pharmacovigilance and manufacturing, as well as claims processing, enrollment, membership and revenue cycle management. Demand is also created by the adoption and integration of digital technologies such as AI and predictive data analytics to improve clinical trial designs, data security, patient engagement and care outcomes.
Our FS segment includes banking, capital markets, payments and insurance companies. Demand in this segment is driven by our clients’ need to modernize legacy technology environments, strengthen operational resilience and adopt cloud, data and AI capabilities to meet evolving customer expectations and regulatory requirements. Our clients are expanding enterprise AI adoption to enhance customer experience, improve risk and fraud management, accelerate underwriting and lending and modernize payments. These initiatives require core platform modernization, greater use of advanced analytics and responsible AI frameworks to ensure transparency, security and compliance.
p. 13 · Read in context →
Services and Solutions — p. 15 · Read the full section →
How the offering is packaged: seven integrated practices, including the newest, Security — the taxonomy behind the revenue.
The seven practices Cognizant sells through, from Core Technologies to the new Security practice.
Our services and solutions are organized into seven integrated practices, which help us deliver these capabilities in ways that align with each client’s specific transformation journey. These practices are Core Technologies and Insights, Enterprise Platform Services, Industry Solutions, Intuitive Operations and Automation, Software and Platform Engineering, Cognizant Moment and our newest practice, Security.
p. 15 · Read in context →
Competition — p. 18 · Read the full section →
Names the direct competitors and the factors Cognizant competes on — a compact map of the IT-services rivalry.
Direct competitors (Accenture, TCS, Infosys, EPAM, HCL…) and the principal competitive factors.
The markets for our services are highly competitive, characterized by a large number of participants and subject to rapid change. Competitors may include systems integration firms, contract programming companies, application software companies, cloud computing service providers, traditional consulting firms, professional services groups of computer equipment companies, infrastructure management companies, outsourcing companies, boutique digital companies and clients' in-house technology resources, such as GCCs. Our direct competitors include, among others, Accenture, Atos, Capgemini, CGI, Deloitte Digital, DXC Technology, EPAM Systems, Genpact, HCL Technologies, IBM Consulting, Infosys Technologies, Tata Consultancy Services and Wipro. In addition, we compete with numerous smaller local companies in the various geographic markets in which we operate. For additional information, see Part I, Item 1A. Risk Factors.
p. 18 · Read in context →
Item 1A. Risk Factors — Intense and evolving competition — p. 27 · Read the full section →
Company-specific bite: smaller local rivals and clients' own captive centers (GCCs) undercut pricing and margins.
Local competitors and in-house Global Capability Centers as a lower-cost alternative to Cognizant.
The markets we serve and operate in are highly competitive, subject to rapid change and characterized by a large number of participants, as described in “Part I, Item 1. Business-Competition.” We compete on the basis of reputation and experience, strategic advisory capabilities, digital and AI capabilities, performance and reliability, responsiveness to customer needs, financial stability, corporate governance and competitive pricing of services. The less we are able to differentiate our services and solutions and/or clearly convey the value of our services and solutions, the more difficulty we have in winning new work in sufficient volumes and at our target pricing and overall economics. In addition to large, global competitors, we face competition in many geographic markets from numerous smaller, local competitors that may have more experience with operations in these markets, have well-established relationships with our desired clients, or be able to provide services and solutions at lower costs or on terms more attractive to clients than we can. Additionally, we face competition from clients' in-house technology resources, such as GCCs, which may provide a lower cost alternative to our services.
p. 27 · Read in context →
Item 1A. Risk Factors — Our use of AI technologies may not be successful — p. 27 · Read the full section →
The defining risk: the same AI Cognizant sells can replace the services it historically performed, cutting demand and pricing.
Why AI competitiveness is 'critical to our financial performance'.
We expect the proliferation of AI will have a significant impact on our industry, and we believe our ability to compete in this space will be critical to our financial performance. We increasingly use AI-based technologies, including GenAI, in our client offerings and our own internal operations.
p. 27 · Read in context →
AI cannibalization stated plainly — services 'replaced by AI or other forms of automation, including our own'.
Some services that we historically performed for our clients have been and will continue to be replaced by AI or other forms of automation, including our own AI-enabled client offerings. Each of the foregoing may lead to reduced demand for our services or harm our ability to obtain favorable pricing or other terms for our services, which could have a material adverse effect on our business, results of operations and financial condition.
p. 29 · Read in context →
Item 1A. Risk Factors — Cybersecurity incidents — p. 34 · Read the full section →
For a firm that hosts and processes client data worldwide, a breach is an existential, client-specific exposure.
Dependence on global IT networks to host clients' confidential data — and the breach exposure it creates.
In order to provide our services and solutions, we depend on global information technology networks and systems, to process, transmit, host and securely store electronic information (including our confidential information and the confidential information of our clients) and to communicate among our locations around the world and with our clients, suppliers, vendors and alliance partners (including numerous cloud service providers). Security breaches, employee malfeasance, or human or technological error have in the past and could in the future cause shutdowns or disruptions of our, our vendors' or our clients' operations and potential unauthorized access and/or disclosure of our or our clients’ sensitive data, which in turn could jeopardize projects that are critical to our operations or the operations of our clients’ businesses and have other adverse impacts on our business or the business of our clients.
p. 34 · Read in context →
Item 7. MD&A — Executive Summary: 2025 Results — p. 51 · Read the full section →
Management's own scorecard: 7% revenue growth and margin expansion, plus the one-off tax charge that split GAAP from adjusted EPS.
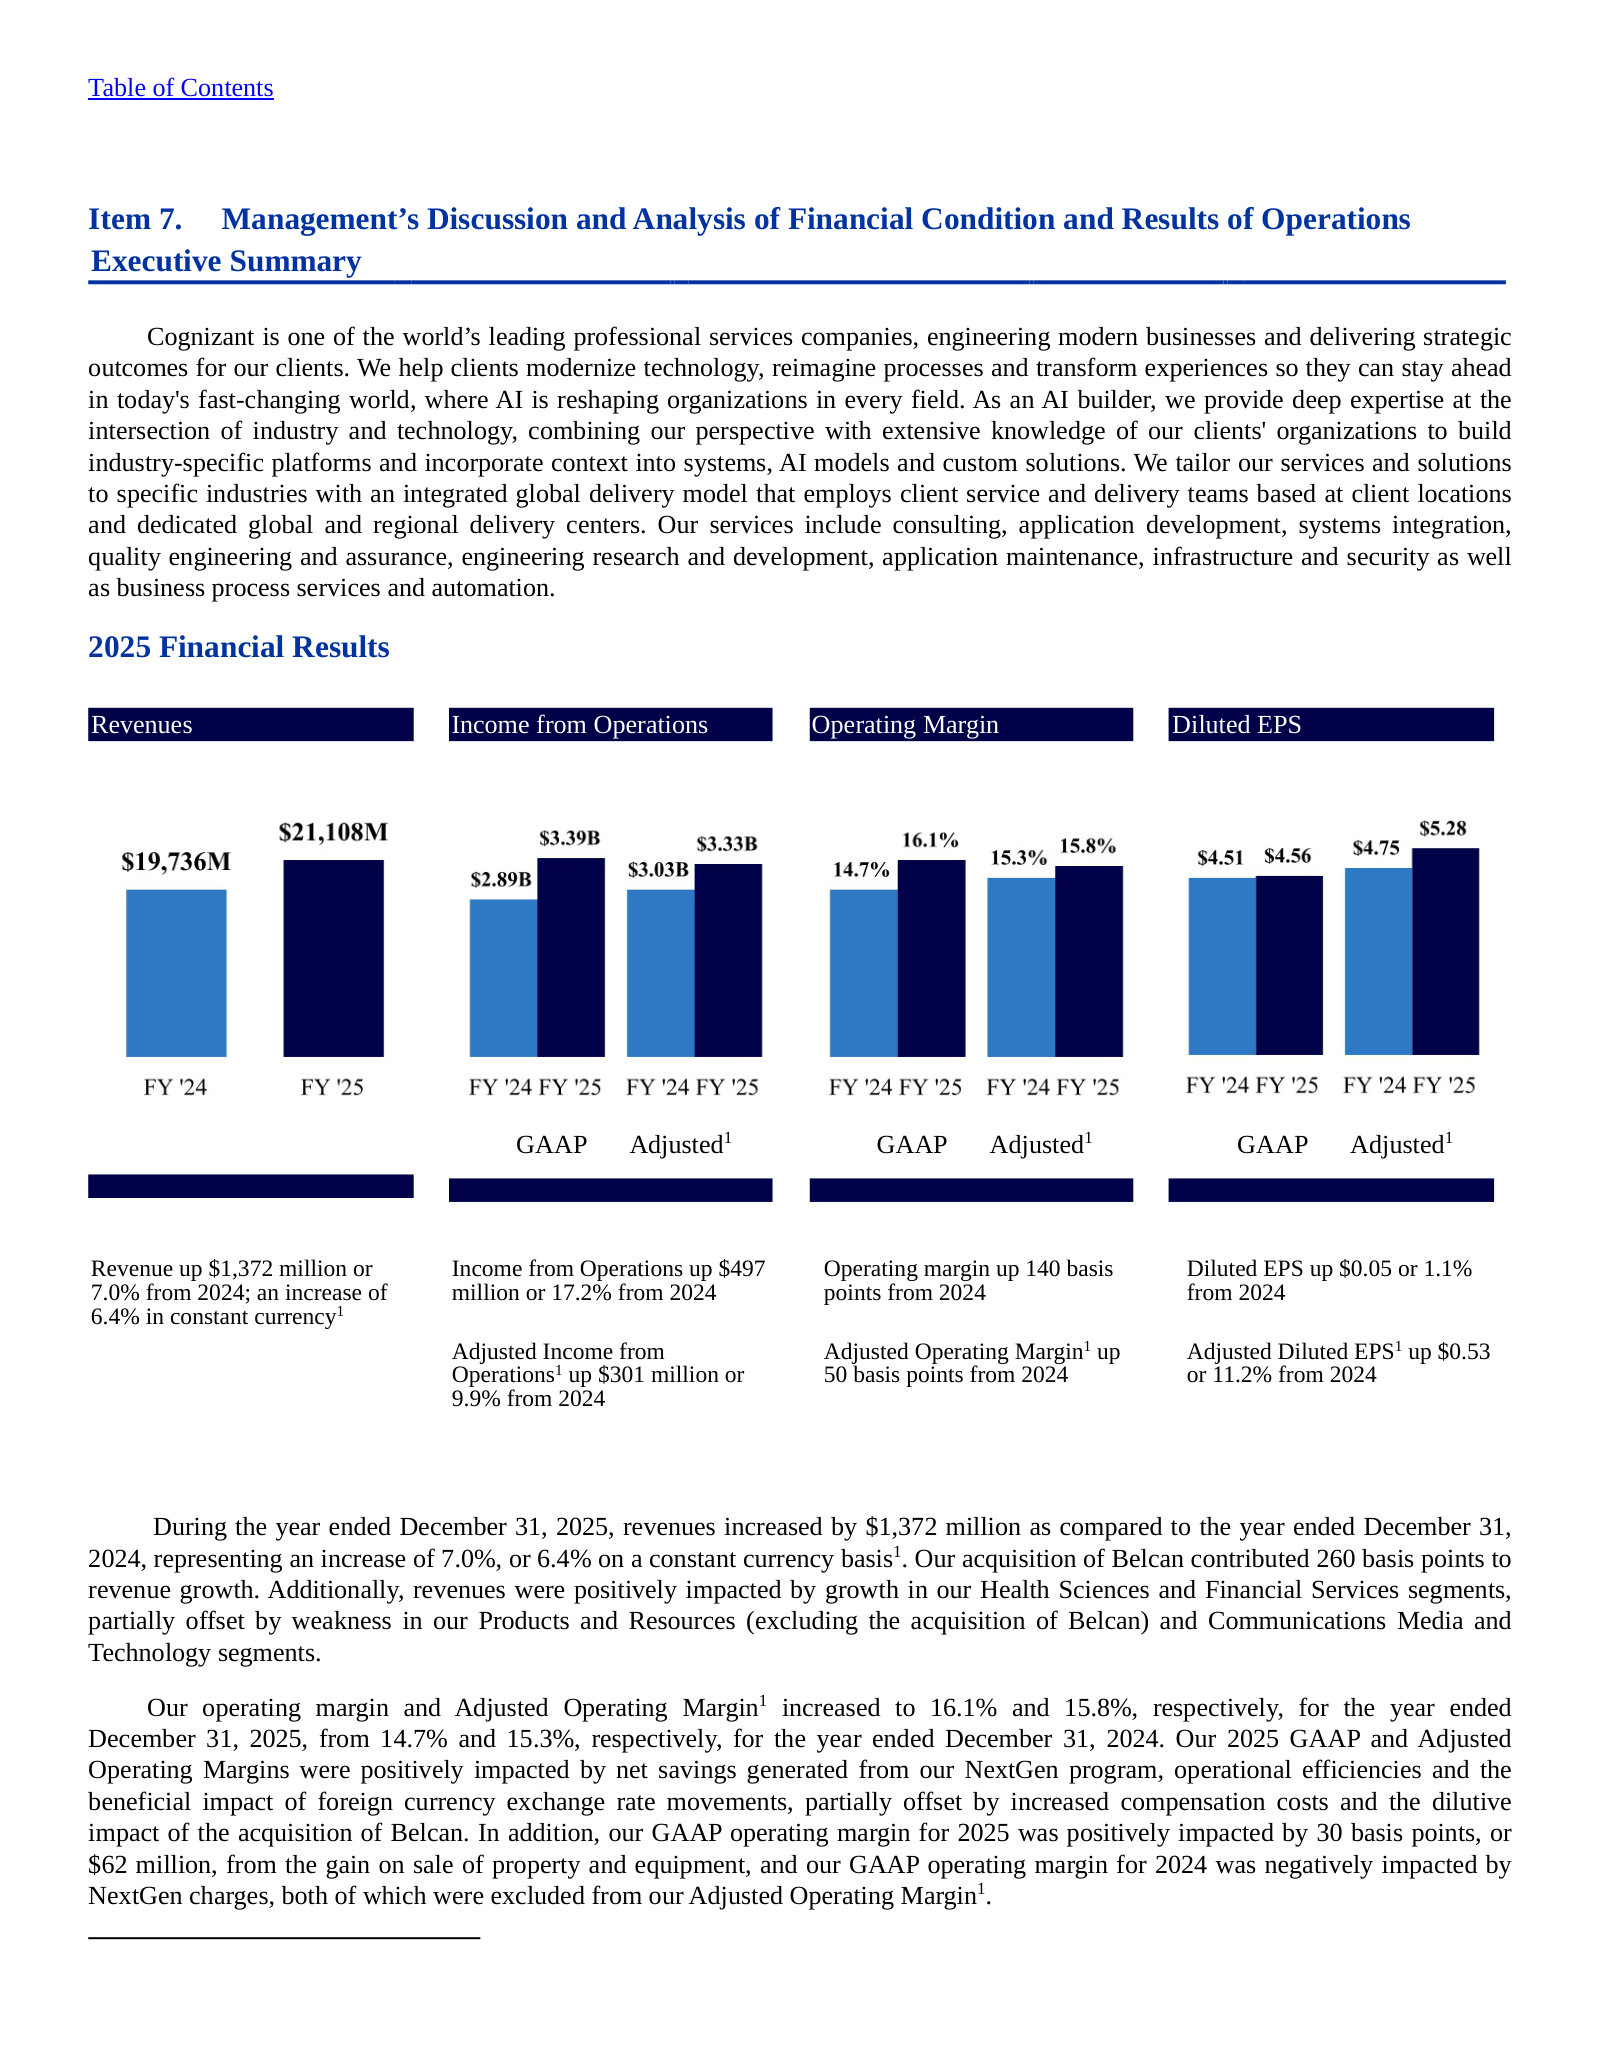
The $390M one-time tax charge from U.S. OBBBA R&E repeal that cut GAAP EPS by $0.80.
In July 2025, the OBBBA was enacted in the United States, which, among other provisions, repealed the requirement to capitalize U.S. R&E costs. As a result, we do not believe it is more likely than not that we will realize our deferred tax asset of $390 million related to R&E costs capitalized outside the United States. These amounts would have otherwise been available to offset certain future U.S. taxes on our non-U.S. earnings, which, as a result of this repeal, we no longer project to be applicable to us. Therefore, in the third quarter of 2025, we recorded a one-time, non-cash income tax expense of $390 million. This impacted our full year 2025 GAAP diluted EPS by $0.80, which is added back for the calculation of Adjusted EPS.
p. 53 · Read in context →
Note 1 — Revenue Recognition — p. 95 · Read the full section →
The accounting policy that defines an IT-services P&L: fixed-price work booked by the cost-to-cost (labor) method.
Five-step model and cost-to-cost recognition on fixed-price development and integration contracts.
Revenue Recognition. We recognize revenues as we transfer control of deliverables (products, solutions and services) to our clients in an amount reflecting the consideration to which we expect to be entitled. To recognize revenues, we apply the following five step approach: (1) identify the contract with a customer, (2) identify the performance obligations in the contract, (3) determine the transaction price, (4) allocate the transaction price to the performance obligations in the contract, and (5) recognize revenues when a performance obligation is satisfied. We account for a contract when it has approval and commitment from all parties, the rights of the parties are identified, payment terms are identified, the contract has commercial substance and collectibility of consideration is probable. We apply judgment in determining the customer’s ability and intention to pay based on a variety of factors, including the customer’s historical payment experience.
For performance obligations where control is transferred over time, revenues are recognized based on the extent of progress towards completion of the performance obligation. The selection of the method to measure progress towards completion requires judgment and is based primarily on the nature of the deliverables to be provided.
Revenues related to fixed-price contracts for application development and systems integration services, consulting or other technology services are recognized as the service is performed using the cost-to-cost method, under which the total value of revenues is recognized on the basis of the percentage that each contract’s total labor cost to date bears to the total expected labor costs.
p. 95 · Read in context →
Cognizant Technology Solutions Corporation — FY2021 Annual Report (Form 10-K) — FY2021 (year ended December 31, 2021)
Included to show the strategy reset: the FY2021 'digital era' positioning (IoT/data/cloud, two practices) against which the FY2025 'AI builder' pivot stands out. · Open the full document →
Item 1. Business — Overview & Services (2021) — p. 7 · Read the full section →
The pre-AI identity — 'engineering modern business for the digital era', investing in IoT, data and cloud — same purpose and vision, different engine.
2021 self-description: 'the digital era', with four investment areas — IoT, digital engineering, data and cloud.
Cognizant is one of the world’s leading professional services companies, engineering modern business for the digital era. Our services include digital services and solutions, consulting, application development, systems integration, application testing, application maintenance, infrastructure services and business process services. Digital services have become an increasingly important part of our portfolio, aligning with our clients' focus on becoming data-enabled, customer-centric and differentiated businesses. We are continuing to invest in digital services with a focus on four key areas: IoT, digital engineering, data and cloud.
p. 7 · Read in context →
Services organized into just two practices in 2021 — before the seven-practice, AI-led structure of FY2025.
In 2021, our services and solutions were organized into two practice areas: Digital Business & Technology and Digital Business Operations. Our consulting professionals have deep industry-specific expertise and work closely with our practice areas to create modern frameworks, platforms and solutions that leverage a wide range of digital technologies across our clients’ businesses to deliver higher levels of efficiency and new value for their customers.
p. 11 · Read in context →
More annual reports
Cognizant Technology Solutions Corporation — FY2024 Annual Report (Form 10-K) — FY2024 · 148 pages · First 10-K with the mandated Item 1C. Cybersecurity disclosure and the maturing AI-services narrative under CEO Ravi Kumar S. · Open →
Cognizant Technology Solutions Corporation — FY2023 Annual Report (Form 10-K) — FY2023 · 149 pages · CEO-transition year; documents the segment structure and early GenAI investment framing. · Open →
Cognizant Technology Solutions Corporation — FY2022 Annual Report (Form 10-K) — FY2022 · 143 pages · Bridges the 'digital' era to the AI era — useful baseline for margins and headcount before the AI pivot. · Open →
Competitors describe Cognizant Technology Solutions Corporation's market in their own filings and calls. These verified passages and visual pages show where their strategies meet, using source documents preserved in Sources.
Tata Consultancy Services (TCS)
The largest India-heritage IT-services firm and Cognizant's closest structural comparator — same global-delivery model, overlapping BFSI/consumer client base, and a direct fight for North American vendor-consolidation and modernization deals.
TCS frames a record quarterly order intake as evidence of share gains, with North America — Cognizant's single largest market — at an all-time-high TCV.
K Krithivasan, CEO & Managing Director: Our record Q4 TCV of $12.2 billion demonstrates our ability to gain market share. North America TCV reached an all-time high of $6.8 billion.
p. 3 · Read in context →
TCS's read of FY2026 client demand — cost optimisation, vendor consolidation, modernisation and AI-readiness — and the scale of its closing order book, the backdrop for the whole IT-services peer set.
clients remained focused on initiatives centred around cost optimisation, vendor consolidation and technology modernisation, including legacy and mainframe transformation. Cloud and data modernisation was another major theme as clients focused on the prerequisites for deploying AI at scale. However, TCS closed the year with a strong and resilient order book of US$ 40.7 billion.
p. 59 · Read in context →
Accenture (ACN)
The largest global IT-services and consulting rival and the pace-setter on AI-services spend; its filings explicitly define the competitor category — including 'off-shore IT service providers… particularly in India' — that Cognizant occupies.
Accenture quantifies its capture of AI-services spend, a market it was first to disclose separately — the demand pool every peer, Cognizant included, is now chasing.
Julie Sweet, Chair & CEO: In FY25, we tripled our revenue over FY24 from Gen AI and increasingly agentic AI to $2.7 billion. And we nearly doubled our Gen AI bookings to $5.9 billion.
p. 7 · Read in context →
Accenture's 10-K competition section describes the field it plays in and names the offshore, India-centric provider category to which Cognizant belongs.
Accenture operates in a highly competitive and rapidly changing global marketplace. We compete with a variety of organizations that offer solutions and services competitive with those we offer—but we believe no other company offers the full range of services at scale that Accenture does […] Our competitors include large multinational IT service providers, including the services arms of large global technology providers; off-shore IT service providers in lowercost locations, particularly in India
p. 11 · Read in context →
Accenture's stated basis for AI leadership: an early, $3bn multi-year investment it credits with positioning it to capture AI spend ahead of rivals.
our early and decisive decision in fiscal 2023 to invest significantly to become a leader in generative AI with a $3 billion multi-year investment has positioned us to capture this new area of spend for our clients.
p. 6 · Read in context →
Infosys (INFY)
A core India-heritage rival competing head-to-head with Cognizant for the same delivery-led transformation contracts; it benchmarks itself explicitly against the peer group.
At its 2026 AGM, Infosys claims sustained peer-relative outperformance and large-deal momentum — a direct competitive-standing statement against the pack that includes Cognizant.
Salil Parekh, CEO & Managing Director: On an organic basis, we have grown faster than our peers for over seven years now. On other parameters, we had a very strong large deal wins at $15 billion with 55% net new. We generated $3.7 billion of free cash flows
p. 45 · Read in context →
Infosys's self-positioning and workforce scale, a marker of the delivery capacity it brings against Cognizant's ~340k-strong base.
Infosys is a global leader in AI-first business consulting and technology services. Over 3,25,000 of our people work to amplify human potential
p. 11 · Read in context →
Infosys's own characterisation of the market Cognizant also serves: intensely competitive and being disrupted by new specialised entrants.
the traditional services market remains intensely competitive, driven by rapid change and the entry of new players in specialized technology niches.
p. 22 · Read in context →
HCLTech (HCLTECH)
A direct India-heritage competitor that names Cognizant in its own performance-benchmarking set and publishes the clearest third-party sizing of the IT-services market both firms address.
HCLTech's stated sizing of the enterprise IT-services market — the total pool Cognizant and its peers divide.
the total addressable market for enterprise IT services, which is the largest segment of enterprise technology spending, is forecasted to be approximately $1.5 trillion by 2028 with a CAGR of 4.9%.
p. 127 · Read in context →
HCLTech's positioning claim — repeated peer outperformance and a self-styled 'bellwether' role in the Indian IT-services industry Cognizant competes within.
This marks the second consecutive year in which HCLTech has outperformed its comparable peers […] Today, HCLTech has firmly established itself as the bellwether of the Indian IT services industry.
p. 58 · Read in context →
Wipro (WIPRO)
A direct India-heritage competitor pursuing the same AI-led, consulting-plus-delivery repositioning as Cognizant; its calls describe the shared demand environment and its own deal scale.
Wipro's stated view of the demand backdrop — AI as market-expanding rather than deflationary — and the consulting-led AI strategy it is pursuing, the same terrain as Cognizant's AI pivot.
Srini Pallia, CEO: The AI disruption is expanding the market, not shrinking it. […] We are executing a consulting-led AI-powered strategy to help our clients reimagine and redesign their enterprise around intelligence.
p. 3 · Read in context →
Wipro's quarterly order intake and large-deal count, a gauge of the deal scale competing for the same client budgets Cognizant targets.
Srini Pallia, CEO: During the quarter, order booking totaled $3.4 billion and large deal bookings totaled $1.6 billion. Our order booking includes 13 large deals this quarter.
p. 4 · Read in context →
More peer documents
Accenture Q1 FY2026 call — 'Advanced AI' bookings & glossary — 34 pages · Accenture defines Advanced AI (GenAI/agentic/physical) and reports the metric it was first in the industry to disclose; a clean framing of the AI-services market. · Open →
TCS Q1 FY2026 call — North America share debate — 29 pages · Krithivasan pushes back on the suggestion TCS is losing North American share, insisting it is winning its 'fair share' in Cognizant's core region. · Open →
Infosys Q4 FY2026 call — AI TAM & share target — 46 pages · A journalist frames the AI addressable market at $300–400bn; Parekh confirms Infosys is targeting a share of that 2030 external-study market. · Open →
HCLTech Q4 FY2026 call — Gartner Customer's Choice & TCV — 25 pages · Claims sole 'Customer's Choice' status across all six Gartner Voice-of-the-Customer IT-services assessments and net-new TCV of $9.3bn for the year. · Open →
Capgemini FY2025 URD — §1.2 market trends & competitor panels — 524 pages · Region-by-region market sizes and competitor panels (naming Cognizant twice), plus the AI-driven demand narrative shaping the shared market. · Open →
Wipro FY2026 AR — 'AI Native Business and Platforms' unit — 561 pages · Wipro stands up a dedicated AI-native business line at the start of FY27, evidencing the structural AI repositioning mirroring Cognizant's. · Open →
Source: S&P Capital IQ consensus via Xpressfeed · Generated 2026-07-17.
Street snapshot
The 25 price targets span $42 to $88, around a $63.90 mean and $65 median.
Currency: USD · Scale: money in millions, absolute (per share) · Analyst counts shown explicitly; recommendation respondents: 29.
| Street view | Reading | Analysts |
|---|---|---|
| Recommendation mix | Buy 11, Outperform 2, Hold 16, Underperform 0, Sell 0 | 29 |
| Consensus score | 2.17 | 29 |
| Target price | mean 63.90; high 88.00; low 42.00 | 25 |
Forward table
Currency: USD · Scale: money in millions, absolute (per share) · Analyst count is the estimate count for each period and metric.
| Period | Metric | Mean | YoY | Analysts | Low / high |
|---|---|---|---|---|---|
| FY0E | Revenue | 22,299 | 5.6% | 29 | 22,162 / 22,416 |
| FY0E | EBITDA | 4,111 | 6.0% | 13 | 3,869 / 4,497 |
| FY0E | EBIT | 3,550 | 6.8% | — | — / — |
| FY0E | Net income (GAAP) | 2,585 | 15.9% | 16 | 2,464 / 2,717 |
| FY0E | Net income (normalized) | 2,696 | 4.7% | — | — / — |
| FY0E | EPS (GAAP) | 5.48 | 20.2% | 18 | 5.24 / 5.73 |
| FY0E | EPS (normalized) | 5.69 | 7.8% | 29 | 5.30 / 5.76 |
| FY0E | Free cash flow | 2,540 | 1.2% | — | — / — |
| FY0E | Dividend per share | 1.32 | 6.7% | — | — / — |
| FY0E | Gross margin | 33.3% | -1.6% | — | — / — |
| FY0E | Capital expenditure | -361.8 | 27.9% | — | — / — |
| FY0E | Net debt | -2,868 | 38.5% | — | — / — |
| FY0E | ROE | 17.5% | 7.0% | — | — / — |
| FY0E | Cash from operations | 2,905 | 3.7% | — | — / — |
| FY+1E | Revenue | 23,408 | 5.0% | 29 | 23,003 / 23,963 |
| FY+1E | EBITDA | 4,452 | 8.3% | 13 | 4,308 / 4,915 |
| FY+1E | EBIT | 3,805 | 7.2% | — | — / — |
| FY+1E | Net income (GAAP) | 2,875 | 11.2% | 16 | 2,829 / 2,906 |
| FY+1E | Net income (normalized) | 2,870 | 6.5% | — | — / — |
| FY+1E | EPS (GAAP) | 6.18 | 12.8% | 19 | 6.00 / 6.29 |
| FY+1E | EPS (normalized) | 6.18 | 8.5% | 29 | 5.95 / 6.30 |
| FY+1E | Free cash flow | 2,821 | 11.1% | — | — / — |
| FY+1E | Dividend per share | 1.42 | 7.4% | — | — / — |
| FY+1E | Gross margin | 33.6% | 0.8% | — | — / — |
| FY+1E | Capital expenditure | -382.7 | 5.8% | — | — / — |
| FY+1E | Net debt | -4,122 | 43.7% | — | — / — |
| FY+1E | Cash from operations | 3,209 | 10.4% | — | — / — |
| FY+1E | ROE | 17.6% | 0.5% | — | — / — |
| FY+2E | Revenue | 24,779 | 5.9% | 16 | 23,818 / 25,676 |
| FY+2E | EBITDA | 4,755 | 6.8% | 9 | 4,495 / 5,309 |
| FY+2E | EBIT | 4,088 | 7.4% | — | — / — |
| FY+2E | Net income (GAAP) | 3,107 | 8.1% | 9 | 3,058 / 3,190 |
| FY+2E | Net income (normalized) | 3,094 | 7.8% | — | — / — |
| FY+2E | EPS (GAAP) | 6.77 | 9.6% | 11 | 6.50 / 7.12 |
| FY+2E | EPS (normalized) | 6.79 | 9.8% | 14 | 6.55 / 7.12 |
| FY+2E | Free cash flow | 3,059 | 8.5% | — | — / — |
| FY+2E | Dividend per share | 1.45 | 1.9% | — | — / — |
| FY+2E | Gross margin | 33.8% | 0.6% | — | — / — |
| FY+2E | Capital expenditure | -411.9 | 7.6% | — | — / — |
| FY+2E | Net debt | -5,760 | 39.8% | — | — / — |
| FY+2E | Cash from operations | 3,451 | 7.6% | — | — / — |
| FY+2E | ROE | 16.5% | -6.7% | — | — / — |
| Q2 FY2026 | Revenue | 5,485 | 4.6% | 23 | 5,458 / 5,507 |
| Q2 FY2026 | EBITDA | 1,000 | 4.6% | 8 | 918.5 / 1,025 |
| Q2 FY2026 | EBIT | 868.5 | 7.6% | — | — / — |
| Q2 FY2026 | Net income (GAAP) | 604.9 | -6.2% | 11 | 532.0 / 657.0 |
| Q2 FY2026 | Net income (normalized) | 651.1 | 5.0% | — | — / — |
| Q2 FY2026 | EPS (GAAP) | 1.30 | -0.9% | 14 | 1.13 / 1.43 |
| Q2 FY2026 | EPS (normalized) | 1.38 | 5.1% | 24 | 1.36 / 1.43 |
| Q2 FY2026 | Free cash flow | 409.0 | 46.9% | — | — / — |
| Q2 FY2026 | Dividend per share | 0.33 | 5.5% | — | — / — |
| Q2 FY2026 | Gross margin | 33.3% | -2.6% | — | — / — |
| Q2 FY2026 | Capital expenditure | -83.22 | 4.6% | — | — / — |
| Q2 FY2026 | Net debt | -1,508 | -8.2% | — | — / — |
| Q2 FY2026 | ROE | 17.0% | -1.6% | — | — / — |
| Q2 FY2026 | Cash from operations | 377.4 | -44.5% | — | — / — |
| Q3 FY2026 | Revenue | 5,706 | 5.4% | 21 | 5,639 / 5,788 |
| Q3 FY2026 | EBITDA | 1,054 | 5.3% | 8 | 898.2 / 1,108 |
| Q3 FY2026 | EBIT | 927.4 | 12.2% | — | — / — |
| Q3 FY2026 | Net income (GAAP) | 646.5 | 135.9% | 11 | 599.1 / 710.0 |
| Q3 FY2026 | Net income (normalized) | 688.5 | 9.0% | — | — / — |
| Q3 FY2026 | EPS (GAAP) | 1.39 | 148.9% | 13 | 1.27 / 1.51 |
| Q3 FY2026 | EPS (normalized) | 1.46 | 5.3% | 23 | 1.43 / 1.51 |
| Q3 FY2026 | Free cash flow | 1,062 | 30.0% | — | — / — |
| Q3 FY2026 | Dividend per share | 0.33 | 5.5% | — | — / — |
| Q3 FY2026 | Gross margin | 33.7% | -1.3% | — | — / — |
| Q3 FY2026 | Capital expenditure | -85.29 | 22.4% | — | — / — |
| Q3 FY2026 | Net debt | -1,913 | 8.2% | — | — / — |
| Q3 FY2026 | ROE | 17.7% | 6.4% | — | — / — |
| Q3 FY2026 | Cash from operations | 1,331 | 31.9% | — | — / — |
| Q4 FY2026 | Revenue | 5,686 | 6.6% | 20 | 5,578 / 5,808 |
| Q4 FY2026 | EBITDA | 1,064 | 7.1% | 7 | 1,044 / 1,085 |
| Q4 FY2026 | EBIT | 927.9 | 10.5% | — | — / — |
| Q4 FY2026 | Net income (GAAP) | 661.7 | 2.1% | 11 | 625.0 / 688.0 |
| Q4 FY2026 | Net income (normalized) | 684.9 | 7.1% | — | — / — |
| Q4 FY2026 | EPS (GAAP) | 1.42 | 5.9% | 13 | 1.27 / 1.48 |
| Q4 FY2026 | EPS (normalized) | 1.46 | 8.4% | 22 | 1.40 / 1.51 |
| Q4 FY2026 | Free cash flow | 816.4 | 4.4% | — | — / — |
| Q4 FY2026 | Dividend per share | 0.33 | 7.7% | — | — / — |
| Q4 FY2026 | Gross margin | 33.8% | -1.7% | — | — / — |
| Q4 FY2026 | Capital expenditure | -79.86 | 20.5% | — | — / — |
| Q4 FY2026 | Net debt | -2,424 | 10.4% | — | — / — |
| Q4 FY2026 | ROE | 17.1% | -0.6% | — | — / — |
| Q4 FY2026 | Cash from operations | 917.5 | 15.2% | — | — / — |
| Q1 FY2027 | Revenue | 5,708 | 5.5% | 16 | 5,650 / 5,819 |
| Q1 FY2027 | EBITDA | 1,058 | 7.5% | 6 | 1,048 / 1,067 |
| Q1 FY2027 | EBIT | 911.8 | 7.6% | — | — / — |
| Q1 FY2027 | Net income (GAAP) | 687.0 | 3.8% | 11 | 657.0 / 718.0 |
| Q1 FY2027 | Net income (normalized) | 687.5 | 7.5% | — | — / — |
| Q1 FY2027 | EPS (GAAP) | 1.48 | 6.2% | 13 | 1.41 / 1.56 |
| Q1 FY2027 | EPS (normalized) | 1.48 | 5.4% | 19 | 1.42 / 1.56 |
| Q1 FY2027 | Free cash flow | 485.4 | -8.9% | — | — / — |
| Q1 FY2027 | Dividend per share | 0.34 | 3.6% | — | — / — |
| Q1 FY2027 | Gross margin | 33.1% | -1.5% | — | — / — |
| Q1 FY2027 | Capital expenditure | -82.35 | -1.1% | — | — / — |
| Q1 FY2027 | Net debt | -2,771 | 96.8% | — | — / — |
| Q1 FY2027 | ROE | 16.8% | -0.8% | — | — / — |
| Q1 FY2027 | Cash from operations | 471.1 | -45.7% | — | — / — |
Estimate momentum
Normalized-EPS estimates have drifted steadily higher across both forward years over the past 180 days, FY2027 from $6.13 to $6.18 and FY2028 from $6.59 to $6.79.
Currency: USD · Scale: money in millions, absolute (per share) · Point-in-time consensus; analyst count is shown where supplied.
| Period | Metric | Lookback | Then | Now | Direction / magnitude | Analysts |
|---|---|---|---|---|---|---|
| 2027 | Revenue | 30d | 23,450 | 23,408 | down 0.2% | — |
| 2027 | Revenue | 90d | 23,539 | 23,408 | down 0.6% | — |
| 2027 | Revenue | 180d | 23,379 | 23,408 | up 0.1% | — |
| 2028 | Revenue | 30d | 24,798 | 24,779 | down 0.1% | — |
| 2028 | Revenue | 90d | 24,947 | 24,779 | down 0.7% | — |
| 2028 | Revenue | 180d | 24,642 | 24,779 | up 0.6% | — |
| 2028 | EPS (normalized) | 30d | 6.74 | 6.79 | up 0.6% | — |
| 2028 | EPS (normalized) | 90d | 6.70 | 6.79 | up 1.3% | — |
| 2028 | EPS (normalized) | 180d | 6.59 | 6.79 | up 2.9% | — |
| 2027 | EPS (normalized) | 30d | 6.16 | 6.18 | up 0.3% | — |
| 2027 | EPS (normalized) | 90d | 6.13 | 6.18 | up 0.8% | — |
| 2027 | EPS (normalized) | 180d | 6.13 | 6.18 | up 0.9% | — |
Beat / miss record
Cognizant has topped consensus on both lines in each of the last eight quarters.
Current sequences by metric: Revenue: 8 consecutive beats; EPS (normalized): 8 consecutive beats.
Currency: USD · Scale: money in millions, absolute (per share) · Consensus is captured before each actual first became effective; analyst count shown per observation.
| Quarter | Metric | Consensus as of | Actual | Surprise | Outcome | Analysts |
|---|---|---|---|---|---|---|
| Q1 FY2026 | Revenue | 5,413 | 5,413 | 0.0% | Beat | — |
| Q1 FY2026 | EPS (normalized) | 1.33 | 1.40 | 5.0% | Beat | — |
| Q4 FY2025 | Revenue | 5,311 | 5,333 | 0.4% | Beat | — |
| Q4 FY2025 | EPS (normalized) | 1.32 | 1.35 | 2.0% | Beat | — |
| Q3 FY2025 | Revenue | 5,318 | 5,415 | 1.8% | Beat | — |
| Q3 FY2025 | EPS (normalized) | 1.30 | 1.39 | 6.7% | Beat | — |
| Q2 FY2025 | Revenue | 5,189 | 5,245 | 1.1% | Beat | — |
| Q2 FY2025 | EPS (normalized) | 1.26 | 1.31 | 4.0% | Beat | — |
| Q1 FY2025 | Revenue | 5,063 | 5,115 | 1.0% | Beat | — |
| Q1 FY2025 | EPS (normalized) | 1.20 | 1.23 | 2.5% | Beat | — |
| Q4 FY2024 | Revenue | 5,070 | 5,082 | 0.2% | Beat | — |
| Q4 FY2024 | EPS (normalized) | 1.13 | 1.21 | 7.5% | Beat | — |
| Q3 FY2024 | Revenue | 4,993 | 5,044 | 1.0% | Beat | — |
| Q3 FY2024 | EPS (normalized) | 1.15 | 1.25 | 9.0% | Beat | — |
| Q2 FY2024 | Revenue | 4,802 | 4,850 | 1.0% | Beat | — |
| Q2 FY2024 | EPS (normalized) | 1.12 | 1.17 | 4.6% | Beat | — |
Where the street disagrees
GAAP EPS is consistently more dispersed than normalized EPS, and FY2029 rests on a single estimate, so it carries no real signal.
Currency: USD · Scale: money in millions, absolute (per share) · Dispersion is high-low divided by absolute mean; analyst count shown per item.
| Period | Metric | Mean | Low | High | Spread / mean | Analysts |
|---|---|---|---|---|---|---|
| Q2 FY2026 | EPS (GAAP) | 1.30 | 1.13 | 1.43 | 23.1% | 14 |
| Q2 FY2026 | Net income (GAAP) | 604.9 | 532.0 | 657.0 | 20.7% | 11 |
| Q3 FY2026 | EBITDA | 1,054 | 898.2 | 1,108 | 19.9% | 8 |
| Q3 FY2026 | EPS (GAAP) | 1.39 | 1.27 | 1.51 | 17.2% | 13 |
| Q3 FY2026 | Net income (GAAP) | 646.5 | 599.1 | 710.0 | 17.2% | 11 |
Source: Visible Alpha consensus via S&P Xpressfeed · Consensus as of 2026-07-16 · generated 2026-07-17.
Model trust
Consensus spans the FY2025 base year through FY2028 estimates, so the set reads as genuine broad consensus rather than a thin panel.
Base currency: USD · VA scales normalized from Abs, M; item currencies and units retained · Coverage depth and vintage; broker count is the maximum represented.
| Brokers | Line items | Last revision |
|---|---|---|
| 22 | 396 | 2026-07-16 |
Operating KPIs
Operating KPIs that would sharpen the read - bookings, book-to-bill, headcount and attrition - carry only one to five brokers, too thin to lean on.
Base currency: USD · VA scales normalized from Abs, M; item currencies and units retained · FY-1A / FY0E / FY+1E; broker count shown per KPI.
| Operating KPI | Source | FY-1A | FY0E | FY+1E | Brokers |
|---|---|---|---|---|---|
| Depreciation and amortization expense | CD | 551,374.83bn Amount | 579,428.26bn Amount | 606,774.28bn Amount | 22 |
| Income from operations | CD | 3,361,574.53bn Amount | 3,429,513.26bn Amount | 3,793,359.88bn Amount | 22 |
| Income from operations - Operating | CD | 3,314,958.36bn Amount | 3,556,859.41bn Amount | 3,795,642.79bn Amount | 22 |
| Revenues | CD | 21,085,694.64bn Amount | 22,303,866.81bn Amount | 23,435,823.42bn Amount | 22 |
| Cost of revenues | CD | 13,946,550.97bn Amount | 14,861,781.52bn Amount | 15,557,530.57bn Amount | 21 |
| Revenues - Total impact(%) | CD | 6.8% | 5.7% | 5.0% | 21 |
| Interest income/(expenses) | CD | 64,501.70bn Amount | 42,065.52bn Amount | 43,579.39bn Amount | 20 |
| Nonoperating income/(expense) | CD | 79,670.76bn Amount | 47,907.74bn Amount | 42,785.01bn Amount | 20 |
| Foreign currency & others | CD | 15,180.56bn Amount | 4,934.19bn Amount | -6,947.00bn Amount | 19 |
| Net cash provided by operating activities | CD | 2,802,580.74bn Amount | 2,818,120.55bn Amount | 3,362,306.18bn Amount | 18 |
| Cash and cash equivalents | CD | 2,614,477.62bn Amount | 2,851,871.46bn Amount | 4,523,875.84bn Amount | 17 |
| Cash and cash equivalents, beginning of year | CD | 2,224,204.29bn Amount | 2,593,103.14bn Amount | 2,945,987.42bn Amount | 17 |
P&L bridge
Margins hold broadly steady - gross margin near 34%, EBITDA margin edging from 18.5% to 18.9% and operating margin from 15.7% to 16.3%.
Base currency: USD · VA scales normalized from Abs, M; item currencies and units retained · Margins are derived against revenue; YoY compares adjacent fiscal columns; broker count shown per line.
| P&L line | FY-1A | FY0E | FY+1E | Brokers |
|---|---|---|---|---|
| Revenue | 21,085,694.64bn Amount | 22,303,866.81bn Amount (5.8% YoY) | 23,435,823.42bn Amount (5.1% YoY) | 22 |
| Gross Profit | 7,137,233.95bn Amount (33.8% margin) | 7,447,374.97bn Amount (33.4% margin; 4.3% YoY) | 7,896,723.34bn Amount (33.7% margin; 6.0% YoY) | 21 |
| Ebitda | 3,892,836.27bn Amount (18.5% margin) | 4,142,639.75bn Amount (18.6% margin; 6.4% YoY) | 4,398,791.09bn Amount (18.8% margin; 6.2% YoY) | 21 |
| Operating Income | 3,314,958.36bn Amount (15.7% margin) | 3,556,859.41bn Amount (15.9% margin; 7.3% YoY) | 3,795,642.79bn Amount (16.2% margin; 6.7% YoY) | 22 |
| Net Income | 2,548,042.19bn Amount (12.1% margin) | 2,685,435.15bn Amount (12.0% margin; 5.4% YoY) | 2,866,994.88bn Amount (12.2% margin; 6.8% YoY) | 21 |
| Eps | 5.21 Amount | 5.68 Amount (9.1% YoY) | 6.17 Amount (8.6% YoY) | 21 |
Consensus dispersion
GAAP diluted EPS also shows a wide ~25% spread against roughly 8% on the operating EPS line, pointing to disagreement below the operating line (tax and non-operating items) rather than in the core business.
Base currency: USD · VA scales normalized from Abs, M; item currencies and units retained · Top high-low spreads relative to absolute mean; requires at least 3 brokers.
| Line item | Period | Mean | Min | Q1 | Q3 | Max | Spread / mean | Brokers |
|---|---|---|---|---|---|---|---|---|
| Foreign currency & others | 2QFY-2026 | -1,024.16bn Amount | -17,000.00bn Amount | -9,000.00bn Amount | 4,125.00bn Amount | 18,258.41bn Amount | 3442.7% | 10 |
| Foreign currency & others | 4QFY-2025 | -350.00bn Amount | -4,750.00bn Amount | -4,000.00bn Amount | 4,000.00bn Amount | 4,000.00bn Amount | 2500.0% | 5 |
| Foreign currency & others | 1QFY-2026 | -1,087.50bn Amount | -10,000.00bn Amount | -7,150.00bn Amount | 4,125.00bn Amount | 14,000.00bn Amount | 2206.9% | 8 |
| Foreign currency & others | FY-2026 | 4,934.19bn Amount | -42,000.00bn Amount | -13,500.00bn Amount | 9,000.00bn Amount | 65,249.63bn Amount | 2173.6% | 19 |
| Foreign currency & others | 3QFY-2026 | -2,152.02bn Amount | -17,000.00bn Amount | -9,750.00bn Amount | 3,125.00bn Amount | 19,000.00bn Amount | 1672.8% | 10 |
| Foreign currency & others | 4QFY-2026 | -3,548.85bn Amount | -27,000.00bn Amount | -9,750.00bn Amount | 3,125.00bn Amount | 20,000.00bn Amount | 1324.4% | 10 |
Quarterly path
Base currency: USD · VA scales normalized from Abs, M; item currencies and units retained · Next four supplied quarters; final column is maximum broker coverage in the row.
| Quarter | Depreciation and amortization expense | Income from operations | Income from operations - Operating | Revenues | Cost of revenues | Total revenue | EPS Diluted, Applicable to common stockholders($) | Broker coverage |
|---|---|---|---|---|---|---|---|---|
| 3QFY-2026 | 146,647.56bn Amount | 870,954.71bn Amount | 921,124.26bn Amount | 5,705,431.18bn Amount | 3,788,750.95bn Amount | 5,705,431.18bn Amount | 1.45 Amount | 22 |
| 4QFY-2026 | 148,200.50bn Amount | 888,977.82bn Amount | 922,960.14bn Amount | 5,695,088.86bn Amount | 3,776,649.34bn Amount | 5,695,088.86bn Amount | 1.46 Amount | 22 |
| 1QFY-2027 | 148,743.48bn Amount | 904,329.00bn Amount | 906,244.43bn Amount | 5,715,854.73bn Amount | 3,817,498.85bn Amount | 5,715,854.73bn Amount | 1.46 Amount | 21 |
| 2QFY-2027 | 150,344.58bn Amount | 931,957.84bn Amount | 931,957.84bn Amount | 5,783,077.67bn Amount | 3,837,897.48bn Amount | 5,783,077.67bn Amount | 1.51 Amount | 21 |
21 stale period values omitted; 0 line items fully removed.
Source: S&P Capital IQ transcripts via Xpressfeed · latest indexed call 2026-04-29 · generated 2026-07-17.
Latest call digest
Cognizant Technology Solutions Corporation, Q1 2026 Earnings Call, Apr 29, 2026 · 2026-04-29T12:30:00
Q1 2026 call (April 29, 2026). The prepared remarks were confident: revenue up 3.9% year-over-year in constant currency (the upper half of the guide), bookings up 21% with 7 large deals including one mega deal above $500 million, Financial Services growth above 10%, a fifth straight quarter of adjusted operating-margin expansion, and adjusted EPS up about 14%. Management announced the Astreya acquisition and launched Project Leap, a restructuring carrying a $230–320 million charge and targeting $200–300 million of 2026 savings, and used the net savings to raise the 2026 adjusted operating-margin guide to 16.0–16.2%.
The Q&A ran more guarded than the script. Analysts pressed on the softening discretionary environment now baked into the Q2 guide, on why AI-driven productivity is not yet showing up as margin leverage, and on whether Project Leap is offensive or defensive. Management kept its unchanged 4–6.5% full-year revenue range while acknowledging the macro has become materially more complex since February, leaning on large-deal ramps and the Astreya contribution as second-half drivers.
Participant coverage from the latest call.
| Group | Participants | Count |
|---|---|---|
| Management | Operator; Tyler Scott — Global Head of Investor Relations, Cognizant Technology Solutions Corporation; Ravi Kumar S — CEO & Director, Cognizant Technology Solutions Corporation; Jatin Dalal — Chief Financial Officer, Cognizant Technology Solutions Corporation | 4 |
| Analysts | Jason Kupferberg — Managing Director & Senior Equity Analyst, Wells Fargo Securities, LLC, Research Division; James Schneider — Senior Research Analyst, Goldman Sachs Group, Inc., Research Division; James Faucette — MD & Equity Analyst, Morgan Stanley, Research Division; Tien-Tsin Huang — Senior Analyst, JPMorgan Chase & Co, Research Division; Surinder Thind — Equity Analyst, Jefferies LLC, Research Division | 5 |
Curated latest-call exchanges; one row per analyst topic.
| Analyst | Firm | Topic | What changed in Q&A |
|---|---|---|---|
| Jason Kupferberg | Wells Fargo Securities | Bookings mix and second-half discretionary assumption | Pushed on new-versus-renewal split and ACV growth, and asked the team to confirm the FY midpoint now assumes better second-half discretionary spend. Management declined to break out new versus renewal, called new share healthy, and confirmed the midpoint assumes some second-half improvement. |
| Jason Kupferberg | Wells Fargo Securities | AI-driven pricing competition | Asked whether competitors are pricing irrationally as AI productivity is passed through to clients. Management framed it as a share-gain opportunity, citing roughly 40% AI-assisted code and AI-infused rate cards. |
| James Schneider | Goldman Sachs Group | AI productivity versus margin leverage; token billing | Questioned why productivity gains are not yet visible as better margins and how tokens are billed. Management pointed to start-up costs on large deals plus bench and integrated-offering investment, and described evolving tokenized (A0–A3) rate cards. |
| James Faucette | Morgan Stanley | Acquisition valuation and free-cash-flow commitment | Probed how the team is pricing acquisitions and what share of free cash flow will fund M&A. Management called it a good time for a value buyer, anchored on platforms and outcome-based models, and pointed to Astreya and TriZetto adjacencies. |
| Tien-Tsin Huang | JPMorgan Chase & Co | Project Leap rationale | Asked whether Project Leap is offensive or defensive and what outcomes to expect. Management framed it as accelerating the future operating model, reshaping the pyramid, and margin-accretive, with most savings reinvested. |
| Surinder Thind | Jefferies LLC | Margin expansion versus reinvestment | Challenged the choice to show margin expansion rather than maximize every dollar of investment in a fast-changing market. Management said it splits savings between growth reinvestment and margin, keeping to its Winner's Circle framing. |
Theme tracker
Themes are curator-classified across supplied calls.
| Theme | Status | Quarters mentioned | Read-through |
|---|---|---|---|
| AI positioning maturing from generative AI to a full-stack "AI builder" | persisted | Q1 2025, Q2 2025, Q3 2025, Q4 2025, Q1 2026 | Earlier gen-AI productivity talk (2023–24) has hardened into a three-vector strategy and, most recently, a self-description as an "AI builder" reforging the firm's first principles. The framing escalates each quarter; the test is revenue, not vocabulary. |
| Large-deal and mega-deal bookings | persisted | Q2 2024, Q3 2024, Q4 2024, Q1 2025, Q2 2025, Q3 2025, Q4 2025, Q1 2026 | Large-deal signings have been the consistent proof point of the Ravi Kumar turnaround, building to 21% bookings growth and a mega deal above $500M in Q1 2026. Management leans on this to bridge a soft discretionary tape. |
| Winner's Circle and steady margin expansion | persisted | Q1 2025, Q2 2025, Q3 2025, Q4 2025, Q1 2026 | The "Winner's Circle" (top-tier growth, margin expansion, EPS ahead of revenue) has been the recurring scorecard since early 2025, with five straight quarters of adjusted-margin expansion by Q1 2026. |
| Financial Services recovery | persisted | Q2 2024, Q3 2024, Q4 2024, Q1 2025, Q2 2025, Q3 2025, Q4 2025, Q1 2026 | Banking returned to growth in mid-2024 and Financial Services has since led the portfolio, reaching double-digit constant-currency growth in Q1 2026 — the clearest end-market tailwind in the history. |
| Restructuring vehicle: NextGen gives way to Project Leap | emerged | Q1 2026 | The NextGen cost program that ran through 2024 is complete; Project Leap is a new restructuring (severance-led charge, 2026 savings, larger fresher intake) introduced in Q1 2026 to fund the AI operating-model shift. |
| India primary offering / secondary listing evaluation | emerged | Q4 2025, Q1 2026 | First surfaced under analyst questioning at Q4 2025 and repeated in Q1 2026 prepared remarks as an ongoing evaluation; a potential capital-structure event worth tracking. |
| Belcan / ER&D aerospace-defense diversification | dropped | Q2 2024, Q3 2024, Q4 2024, Q1 2025 | Belcan was a headline diversification story through 2024 and early 2025 (roughly 250 bps of 2025 growth). By Q1 2026 it has anniversaried and dropped out of the narrative, with 3Cloud and Astreya now carrying the inorganic story. |
Guidance ledger
Quotes, calls, and speakers are source-verified; outcomes are curator-classified.
| Verbatim guidance | Call | Speaker | Curator outcome | Outcome note |
|---|---|---|---|---|
| “For the full year 2025, we expect revenue to increase 2.6% to 5.1% or 3.5% to 6% in constant currency.” | Cognizant Technology Solutions Corporation, Q4 2024 Earnings Call, Feb 05, 2025 · 2025-02-05T22:00:00 | Jatin Dalal | kept | FY2025 constant-currency revenue grew 6.4%, above the high end of this initial range. |
| “For the full year, we expect adjusted operating margins will be 15.5% to 15.7%.” | Cognizant Technology Solutions Corporation, Q4 2024 Earnings Call, Feb 05, 2025 · 2025-02-05T22:00:00 | Jatin Dalal | kept | FY2025 adjusted operating margin was 15.8%, above the guided range. |
| “This leads to full year 2025 earnings per share guidance of $4.90 to $5.06.” | Cognizant Technology Solutions Corporation, Q4 2024 Earnings Call, Feb 05, 2025 · 2025-02-05T22:00:00 | Jatin Dalal | kept | FY2025 adjusted EPS was $5.28, above the guided range. |
| “We, therefore, now expect full year revenue to grow 6% to 6.3% in constant currency, above our prior guidance range of 4% to 6%.” | Cognizant Technology Solutions Corporation, Q3 2025 Earnings Call, Oct 29, 2025 · 2025-10-29T12:30:00 | Jatin Dalal | kept | Full-year 2025 constant-currency revenue finished at 6.4%, at/above this raised range. |
| “We now expect revenue to be in the range of $19.3 million to $19.5 billion, which is a decline of 0.5% to growth of 1% year-over-year, both as reported and in constant currency.” | Cognizant Technology Solutions Corporation, Q2 2024 Earnings Call, Jul 31, 2024 · 2024-07-31T21:00:00 | Jatin Dalal | kept | FY2024 revenue was $19.7 billion, up 1.9% in constant currency, above this range (the '$19.3 million' figure is a transcript typo for billion). |
| “This leads to adjusted diluted EPS guidance of $5.56 to $5.70 representing 5% to 8% year-over-year growth.” | Cognizant Technology Solutions Corporation, Q4 2025 Earnings Call, Feb 04, 2026 · 2026-02-04T13:30:00 | Jatin Dalal | pending | FY2026 guidance; raised one quarter later to $5.63–$5.77 at the Q1 2026 call. |
| “This leads to EPS guidance of $5.63 to $5.77, representing 7% to 9% growth.” | Cognizant Technology Solutions Corporation, Q1 2026 Earnings Call, Apr 29, 2026 · 2026-04-29T12:30:00 | Jatin Dalal | pending | Current FY2026 EPS guidance; not yet resolved within the call history. |
| “The program is expected to deliver savings in 2026 of approximately $200 million to $300 million with a full year benefit in 2027.” | Cognizant Technology Solutions Corporation, Q1 2026 Earnings Call, Apr 29, 2026 · 2026-04-29T12:30:00 | Jatin Dalal | pending | Project Leap savings target for 2026, with the full benefit expected in 2027. |
Q&A pressure map
Question counts and firms are curator tallies; analyst coverage shown above.
| Topic | Questions | Firms | Pressure / response |
|---|---|---|---|
| Bookings quality and large-deal durability | 45 | JPMorgan Chase & Co, Morgan Stanley, TD Cowen, Wells Fargo Securities, Goldman Sachs Group, Guggenheim Securities, BofA Securities, Wolfe Research | The single most pressed area across the 12 calls: new-versus-renewal mix, ACV versus TCV, book-to-bill, and whether large-deal signings actually convert to revenue. Management consistently declines to break out new versus renewal, which analysts keep probing. |
| Discretionary spending and macro trajectory | 34 | JPMorgan Chase & Co, Morgan Stanley, Barclays Bank PLC, Jefferies LLC, Deutsche Bank AG, Wells Fargo Securities, TD Cowen, William Blair & Company L.L.C. | Repeated questioning on whether discretionary spend is recovering or softening and what the second-half assumptions are — the tone flipped from 'green shoots' in 2024 to renewed caution by Q1 2026. |
| Margin trajectory (gross versus operating) | 27 | Goldman Sachs Group, JPMorgan Chase & Co, TD Cowen, Wells Fargo Securities, Guggenheim Securities, BMO Capital Markets Equity Research, Jefferies LLC, William Blair & Company L.L.C. | Persistent tension between soft gross margin (integrated offerings, bench, comp) and continued operating-margin expansion driven by SG&A leverage and the pyramid — analysts keep asking when gross margin stabilizes. |
| AI pricing and productivity pass-through | 22 | Goldman Sachs Group, Morgan Stanley, Deutsche Bank AG, BofA Securities, Wells Fargo Securities, Wolfe Research, Susquehanna Financial Group | How much AI productivity is shared with clients versus retained, deflation risk to time-and-materials, and how tokenized rate cards will be billed. Management argues the unit-count shift is a share-gain lever, not a yield problem. |
| Health Sciences regulation and TriZetto | 8 | Goldman Sachs Group, JPMorgan Chase & Co, TD Cowen, Susquehanna Financial Group, Wedbush Securities Inc., DeepDive Equity Research | Recurring but lower-volume pressure on payer/policy overhang and the durability of the TriZetto-anchored health-care franchise, more recently tied to the Palantir partnership. |
Language shifts
Only language evidence verified against the referenced component is shown.
| Observation | Verbatim evidence | Call ID | Component |
|---|---|---|---|
| After several quarters of improving-demand commentary, the latest call opens with explicit softening language. | “We achieved these results against a softening demand environment.” | 1993881231 | 2 |
| Management flags that macro complexity has increased and is expected to persist near-term — a step back from 2025's recovery tone. | “Market conditions have become more complex since the start of the year, and we expect the impact from heightened macroeconomic uncertainty to persist in the near term.” | 1993881231 | 2 |
| The strategic self-description has escalated from IT services / system integrator to 'AI builder,' reframing the whole operating model. | “This transformative potential is reforging our industry's first principles, which underpin our evolving posture as an AI builder.” | 1993881231 | 2 |
The history reads as a credible multi-year turnaround: from Ravi Kumar's early large-deal push and the NextGen cost work to five straight quarters of margin expansion and consistent guidance beats through 2025. The current debate is whether that momentum survives a re-softening discretionary environment while the company simultaneously funds a fresh restructuring (Project Leap) and leans hard into an unproven 'AI builder' repositioning. Bookings strength and Financial Services are the bull's evidence; the macro caution now baked into near-term guidance is the bear's.
Cognizant: The Business and the 2026 Derating
Cognizant is one of the world's largest IT-services firms — $21.1 billion of 2025 revenue, roughly 351,600 employees, and $2.6 billion of free cash flow — yet its shares have roughly halved since December 2025, from $83 to about $44, to trade near eight times forward earnings. The company is still guiding to growth. This chapter establishes what Cognizant is, how it earns, and the size of the gap between its operating results and its share price.
What Cognizant does
Cognizant sells technology and business services — application development and maintenance, systems integration, cloud and data work, consulting, and business-process operations — delivered through a global workforce that is overwhelmingly based in India. As of December 31, 2025 it employed approximately 351,600 people, of whom 256,900 (about 73%) were in India and 41,600 in North America [1]. The economic engine is straightforward: Cognizant bills clients — largely in the United States and Europe — for the time and output of that lower-cost delivery base. Revenue is therefore closely tied to headcount, utilization, and pricing per person. That labor-arbitrage model is the source of both its cash generation and the doubt now embedded in its price, which values the model near eight times forward EPS and below one times revenue.
The company went to market in 2025 across four industry-based reportable segments — Health Sciences, Financial Services, Products and Resources, and Communications, Media and Technology [2]. Health Sciences and Financial Services together are close to 60% of revenue; the concentration in healthcare and banking clients is a defining feature of the demand base.
Source: FY2025 Annual Report (Form 10-K), Revenues by Reportable Segment [3].
Founded in 1994 as an in-house technology unit of Dun and Bradstreet, Cognizant grew for two decades as one of the fastest-growing names in IT services before its growth converged with the industry. It is not founder-led: Ravi Kumar S, previously president of Infosys, has been chief executive officer since January 2023 — the company's third CEO in that role since founder Francisco D'Souza stepped down [4].
The economics: modest growth, steady cash
Revenue reached $21.1 billion in 2025, up 7.0% (6.4% in constant currency), with the Belcan acquisition contributing about 260 basis points — so organic growth was low-to-mid single digit [5]. Operating income was $3,389 million, a 16.1% GAAP operating margin, and net income was $2,230 million, or $4.56 in diluted EPS [6].
2025 Revenue
Operating Margin
Free Cash Flow
Diluted EPS
Source: FY2025 Annual Report (Form 10-K), Statements of Operations [7] and Statements of Cash Flows [8].
The multi-year record shows the shape a value investor cares about more than any single year: revenue has compounded at only about 4% a year since 2018, operating margin dipped toward 13–15% in the early 2020s and has recovered to 16%, and free cash flow has sat in a $1.8–2.9 billion band throughout. This is a mature, cash-generative business growing in the low single digits — not a decelerating one falling apart, and not a compounder.
Source: derived from reported financials, FY2018–FY2025 10-Ks; 2025 lines cited above [9][10].
Source: derived from reported financials, FY2018–FY2025 10-Ks [11].
Cash conversion is real, and management returns a large share of it. In 2025 Cognizant generated $2,883 million of operating cash flow and returned close to $2.0 billion to shareholders — $1,378 million of buybacks and $610 million of dividends [12]. The dividend was $1.24 per share, and the board's repurchase authorization stood at $13.5 billion with $1,918 million remaining at year-end [13]. Buybacks have shrunk the share count from 584 million in 2018 to 479 million at the end of 2025. The company carries a net cash position — about $949 million at the end of the first quarter of 2026 — so bankruptcy risk is not part of this story [14].
The 2026 derating
Cognizant was a market favorite for most of its life. The stock climbed from single digits in the 2000s to an all-time high above $93 in early 2022, dipped, and recovered to $83 by the end of 2025. Then, over the first half of 2026, it fell to a low of $38.73 in June and trades near $44 now — below where it closed in 2013.
Source: market data, as reported (year-end closing prices; 2026 point is the July 17, 2026 close).
What makes the move notable is that it happened against operating results that held up. In the first quarter of 2026 revenue was $5.4 billion, up 3.9% in constant currency; bookings grew 21% year over year, one of the company's strongest quarters in recent history, to a trailing book-to-bill of 1.4 [15][16]. Management kept its full-year 2026 revenue guidance at 4% to 6.5% constant-currency growth [17], raised its adjusted operating-margin guidance to 16%–16.2%, guided adjusted EPS to $5.63–$5.77 (7%–9% growth), and reaffirmed a plan to return about $1.6 billion of capital in 2026 [18]. The company describes its strategy as becoming a "permanent AI builder," and management itself flagged a "softening demand environment" and greater macro uncertainty since the start of the year [19].
At roughly $44, the arithmetic is stark. The market values Cognizant at about $21 billion — close to one times revenue, and, net of cash, near eight times the midpoint of management's own 2026 EPS guidance, against a trailing free-cash-flow yield above 12% and a dividend yield near 2.8%.
Share Price
Fwd P/E (2026E)
Trailing FCF Yield
Analyst Mean Target
Source: share price and analyst targets from market data, as reported; forward P/E on management's 2026 adjusted-EPS guidance midpoint [20]; FCF yield on FY2025 free cash flow [21].
A multiple that low on a cash-generative, net-cash business is either an opportunity or a warning. The bear reading is that the market is not mispricing near-term earnings; it is repricing the durability of the model. Cognizant's revenue is a function of billable people, and generative AI threatens to break the historical link between client value and headcount — the very engine described above. The bull reading is that the fear has run ahead of the evidence: bookings are accelerating, margins are expanding, the balance sheet is clean, and management is reinvesting cash into the AI transition rather than harvesting a declining business.
The question this report takes up
The gap between Cognizant's operating record and its share price is the reason this report exists. Two facts are not in dispute: the business still grows and still converts profit into cash, and the market has cut its value roughly in half in seven months. The future will prove one of those two readings right; the rest of this report tests which.
Through-line: Is Cognizant's ~50% derating to about eight times forward earnings a durable cash generator mispriced by fear that generative AI will erode labor-arbitrage IT services — offering a value investor a margin of safety — or a rational discount on a headcount-linked model that is genuinely being disrupted?
Two features frame that question for a margin-of-safety investor at the outset. In its favor: a net-cash balance sheet, free cash flow above 12% of the current market value, and low-single-digit revenue growth that has not yet broken. Against it: the revenue base is tied to billable headcount at the exact moment the market fears AI will sever that link, insider ownership is low, and there is no founder at the helm — the last two are cautions this reader weighs before capital, not after. The rest of this report tests the two sides of that gap against the primary record, year by year.
The derating is most sensitive to a single fear: that generative AI severs the historical link between billable headcount and revenue, collapsing a labor-arbitrage model into a shrinking one. Cognizant's own filings concede AI is already replacing some of the work it sells [1]. But the numbers show the link bending, not breaking: revenue per employee rose from roughly $56,000 to $60,000 across 2021–2025, and management is re-pricing toward outcomes. The mechanism a bear fears is also the lever a bull needs.
The link the model depends on
For three decades this business converted low-cost engineering hours into client value: more projects meant more people, and more people meant more revenue. Cognizant's CEO describes the old world plainly — "for much of the last 30 years, IT services grew through a linear model. More people and more projects drove incremental growth" [2]. Revenue tracking headcount is visible in the raw counts: the company ended 2025 with approximately 351,600 employees, 256,900 of them in India [3], against roughly 330,600 in 2021 [4].
The company states the disruption risk in its own risk factors, without euphemism: "Some services that we historically performed for our clients have been and will continue to be replaced by AI or other forms of automation, including our own AI-enabled client offerings" [5]. The 2025 10-K adds the pricing corollary: reductions and replacements "can negatively impact our results of operations if we are unable to adapt our pricing," and it names clients' in-house global capability centers as a lower-cost alternative to Cognizant's services [6]. That is the bear case, stated by the company: if a unit of client value takes fewer billable hours, a headcount-priced revenue line has to fall unless something replaces it.
What the numbers actually show
If AI were breaking the model, the first place it would appear is revenue per employee — falling, as automation strips out the billable hours faster than new work replaces them. It is doing the opposite, modestly.
Revenue per employee = annual revenue ÷ year-end headcount. Revenue from Form 10-K income statements; year-end employee counts from each year's 10-K [7] [8].
The story the crude annual figures tell is a trough in 2022 — the tail of a post-pandemic hiring surge that pushed headcount to 355,300 ahead of revenue — followed by a recovery to about $60,000 per head by 2025, a 7% gain over the full window and roughly 2% a year. The single clearest year was 2024, when headcount fell by about 11,000 while revenue still grew. Management measures the same trend on a trailing-twelve-month basis and reports a steeper slope: revenue per employee up 8% year-over-year and operating income per employee up 10% in the third quarter of 2025 [9], and up 5% on revenue with 8% on margin per person by the fourth quarter [10]. The company's richer figures partly reflect acquisitions and mix; the year-end arithmetic is more conservative. Both point the same way.
Revenue, headcount and derived revenue per employee, FY2021–FY2025, from Form 10-K filings [11].
The pricing model is shifting to match. Fixed-price and success-based contracts are now about half of the total — an analyst put the figure at "about 50%" on the fourth-quarter call, and the CFO did not dispute it, describing a portfolio where "the larger component of delivery risk resides with the service provider" [12]. Management frames the direction as "shifting our economics from labor-based to outcome-based models," noting the combined fixed-price and transaction-based book has grown as a share of revenue over three years [13]. Two concrete proof points sit underneath the framing: business process outsourcing — the service most exposed to automation — grew 9% year-over-year in the fourth quarter, and digital engineering grew 8% [14]. By early 2026 the company said nearly 40% of its code was AI-assisted and it was running "well over 5,000 AI engagements," up from about 4,000 three months earlier [15].
This is a company spending to get ahead of its own disruption rather than waiting for it: it committed roughly $1 billion to generative-AI capabilities over three years back in 2023 [16] and reports having put more than 340,000 associates through AI skilling [17]. The honest read of the evidence: nonlinearity is real but early. Revenue per head is rising a few points a year, not stepping up; the fixed-bid shift is genuine but its margin economics are unproven at scale. The bull claim that AI turns this into a nonlinear growth machine is only faintly visible in the P&L, and the bear claim that it collapses the revenue line is not visible at all.
Where the industry is heading
The disruption question is not Cognizant's alone, and the outside evidence cuts against the extreme bear read. Industry data compiled by NASSCOM, cited in Wipro's FY2026 annual report, has global IT-services spending growing 4.6% in calendar 2025 — with "AI reshaping operating models and talent requirements rather than driving broad displacement" [18]. The nonlinearity Cognizant reports is showing up sector-wide: HCLTech's CEO told investors his firm had "grown 4%-5% and our headcount has not grown" over the prior couple of years [19]. Growth is decoupling from headcount across the industry, which is consistent with margin expansion, not revenue collapse — so far.
Where the incremental growth is headed is the contested part. Cognizant's own answer is a "three-vector" strategy built around what it calls the AI velocity gap — the distance between what enterprises have spent on AI infrastructure and the business value they have realized. It cites internal research putting the prize at "$4.5 trillion in US labor value," to be captured through AI-led productivity, "industrializing AI," and building new agentic workflows that expand total addressable spend [20]. That is a large, self-generated number and should be read as ambition, not forecast. The load-bearing point for an investor is narrower: the same technology that could deflate a per-hour revenue line is also the reason enterprises need a systems integrator to move from experimentation to production — the demand Cognizant is billing against in those 5,000 engagements. Which force dominates will decide the derating, and it resolves in the numbers over the next several quarters, not in the narrative.
Bending, not breaking
The evidence points to a model bending toward nonlinearity, not breaking under it. Revenue per employee is rising, the pricing mix is moving to outcomes, the most automatable service line (BPO) is growing fastest, and the industry body and peers describe AI as reshaping the labor model rather than displacing the revenue. The strongest fact against that read is the company's own admission that AI is already replacing services it used to sell [21], combined with the thinness of the proof: a few points of revenue-per-head gain and a fixed-bid book whose realized margins the CFO says are "very close" to plan but which has not been tested through a full technology transition [22]. What would change the read: revenue per employee stalling or reversing while headcount holds, or fixed-price contracts underrunning their assumed cost curves — either would mean the productivity Cognizant is pricing away to clients is not coming back as margin. Neither has happened yet. The nonlinearity thesis is intact but unproven — a state consistent with the stock's ~8x forward multiple rather than proof of it.
Cash Conversion
The margin-of-safety case depends on something the prior chapters asserted but did not test: that Cognizant's reported profit is real cash. It largely is. Over 2021–2025 operating cash flow converted net income at about 1.1 times, capital intensity is under 2% of revenue, stock-based pay is small, and the "adjusted" earnings back out a net gain at the operating line rather than a pile of charges. Two caveats temper it: the headline free-cash-flow yield leans on 2025's strong print, and receivables are drifting.
Profit turns into cash, but not evenly
Across five years Cognizant generated $12.4 billion of operating cash flow against $11.0 billion of net income — a cumulative conversion of roughly 1.12x. But the year-to-year path is lumpy. Conversion dipped below 1.0x in 2024, when operating cash flow fell to $2.12 billion and free cash flow to $1.83 billion [1], then rebounded to $2.88 billion of operating cash flow and $2.6 billion of free cash flow in 2025 [2].
Source: derived from FY2023–FY2025 10-Ks, Consolidated Statements of Cash Flows [3]. Free cash flow = operating cash flow less capital expenditure.
5-yr Cash Conversion (OCF/NI)
2025 Free Cash Flow ($M)
Capex / Revenue
Stock-Based Pay ($M)
Source: derived from FY2021–FY2025 10-Ks, cash-flow and income statements [4].
Two features stand out before any adjustment. Capital expenditure is trivial — $288 million in 2025, about 1.3% of revenue — so operating cash flow drops through to free cash flow almost intact; this is an asset-light services model, not a capex compounder. And stock-based compensation is only $181 million, under 1% of revenue and roughly 8% of net income [5]. For a technology employer of 351,600 people, that is a restrained use of equity — the free cash flow is not being quietly handed to staff and bought back at a loss.
Two one-off tax items, not deteriorating quality
The swing from 0.95x conversion in 2024 to 1.29x in 2025 looks alarming until it is decomposed. Both endpoints are distorted by identifiable, non-recurring tax events, and stripping them out leaves conversion almost flat at ~1.1x in both years.
The 2024 trough was deepened by a $360 million payment made in January 2024 to settle a dispute with the Indian Income Tax Department — a cash outflow the company names explicitly as having reduced that year's operating cash flow [6]. Add it back and 2024 operating cash flow is about $2.48 billion, or 1.11x net income.
The 2025 spike is the mirror image. In the third quarter of 2025 Cognizant booked a $390 million one-time, non-cash income tax charge tied to the One Big Beautiful Bill Act, which repealed the requirement to capitalize research costs and rendered a deferred tax asset unrealizable [7]. That charge cut GAAP net income and diluted EPS by $0.80 [8] — which is why reported net income was flat at $2.23 billion even as income from operations rose 17% to $3.39 billion [9]. Because the charge is non-cash, it added straight back in the cash-flow statement (deferred taxes swung by $682 million year-over-year), so operating cash flow was untouched. Normalizing net income up by $390 million puts 2025 conversion at 1.10x — the same as the adjusted 2024 figure.
The 0.95x-to-1.29x swing in reported cash conversion is almost entirely two one-time tax items — a $360 million India settlement paid in 2024 and a $390 million non-cash OBBBA charge booked in 2025. On a normalized basis, Cognizant converted net income to operating cash at about 1.1x in both years.
Notably, the same OBBBA change that hurt GAAP earnings helped cash: the repeal reduced 2025 cash taxes by roughly $200 million versus the company's prior projections [10]. GAAP earnings understate the 2025 cash story, not the reverse — the opposite of the pattern a skeptic usually finds.
Receivables are the slow leak worth watching
The clearest drag on quality is working capital. Trade receivables consumed $366 million of cash in 2025, up from $49 million in 2024 and $43 million in 2023 [11]. The company's own days-sales-outstanding measure — which includes contract assets, net of deferred revenue — rose from 77 days at the end of 2023 to 78 in 2024 and 81 in 2025 [12], and reached 84 days in the first quarter of 2026, up three days both sequentially and year-over-year [13].
Source: FY2025 10-K, Liquidity and Capital Resources [14]; Q1 FY2026 earnings call [15].
Four days of DSO across two years is not a crisis — collections are still well inside a normal services-industry band, and the first quarter is seasonally the weakest for cash (Q1 2026 free cash flow was about $200 million, held down by the annual bonus payout) [16]. But the direction is consistent, and it ties directly to the re-pricing described in The Nonlinearity Test. The DSO metric includes contract assets, and as the fixed-price and outcome-based book grows toward half of revenue and deal durations lengthen, more revenue is recognized ahead of billing. The nonlinear re-pricing carries a real cash-timing cost; it does not erase the cash, but it slows the conversion, and it is the first place a deteriorating fixed-bid book would show up.
Adjusted earnings, drawn conservatively
Where many companies use "adjusted" figures to inflate a story, Cognizant's adjustments run the other way at the operating line. Reported 2025 operating margin of 16.1% is higher than the adjusted 15.8%, because the largest 2025 item — a $62 million gain on the sale of property — is stripped out of the adjusted number [17]. The EPS bridge from $4.56 GAAP to $5.28 adjusted is dominated by the legitimately one-time OBBBA charge, not by recurring "special items."
Source: FY2025 10-K, non-GAAP reconciliation [18].
One item worth watching is the cadence of restructuring. Cognizant ran a "NextGen" program in 2023–2024 that produced a $134 million operating charge in 2024, excluded from adjusted results [19]. It is now launching "Project LEAP," expected to cost $230 million to $320 million — substantially all in 2026 — again to be adjusted out of non-GAAP measures [20]. A company that runs a named, adjusted-out restructuring program every two to three years is, in effect, treating a recurring cost as a series of one-offs. The mitigant is that the magnitudes are modest (roughly 1% to 1.5% of revenue, spread over a year) and management has attached a measurable payoff: $200 million to $300 million of 2026 savings, with full-year benefit in 2027, funding the raised 16–16.2% margin guidance [21]. Whether that payoff reaches reported margins will show whether these are genuinely non-recurring.
What would change the read
On the evidence, the cash behind the valuation is real: conversion is steady near 1.1x once the two tax one-offs are removed, capital intensity and equity dilution are low, and the adjustments are conservative rather than flattering. The honest qualifier is that the headline free-cash-flow yield is drawn from the best year. On 2025's $2.6 billion of free cash flow, the yield against roughly $21 billion of market value is above 12%; on the five-year average of about $2.18 billion, it is closer to 10% — still a double-digit yield, but not the peak figure. Management's own 2026 guidance frames the steady state honestly: free-cash-flow conversion of 90% to 100% of net income, and a normalized 25–26% tax rate [22].
The read would weaken on two specific signals: DSO climbing past the mid-80s while cash conversion falls below 1.0x on a normalized basis — evidence the outcome-based book is trapping cash rather than merely timing it — or Project LEAP charges recurring in 2027 and beyond without the promised savings appearing in the margin line. Neither is present in the record today; both are cheap to monitor each quarter.
Standing Among Peers
Set against the firms it names as rivals, Cognizant is a middle-of-the-pack operator, not a broken one. Its 16.1% operating margin and cash returns sit inside the peer band; what trails is growth — a three-year revenue CAGR near 3% against 6–9% at the faster India-heritage names. The market pays for that growth, valuing Tata, Infosys and HCLTech at 15–20 times earnings while pricing Cognizant near nine, alongside Capgemini. And the 2026 halving was the sector's, not Cognizant's: every peer fell 26–48%, Accenture hardest.
The peer set is mutual and real
Cognizant's own 10-K names its direct competitors: "Accenture, Atos, Capgemini, CGI, Deloitte Digital, DXC Technology, EPAM Systems, Genpact, HCL Technologies, IBM Consulting, Infosys Technologies, Tata Consultancy Services and Wipro" — plus, tellingly, clients' in-house technology resources, "such as GCCs" (global capability centers) [1]. The recognition runs both ways: HCLTech's FY2025 annual report benchmarks its own nine-year performance against a "comparison set [that] includes Accenture, TCS, Infosys, Cognizant, Wipro, Tech Mahindra, and HCLTech" [2]. These are the right comparables — the same offshore-delivery, application-and-outsourcing model examined in The Nonlinearity Test, run at similar scale. The six with full financials in this corpus — Accenture, Tata Consultancy Services, Infosys, Wipro, HCLTech and Capgemini — are the benchmark used throughout this chapter.
By revenue, Cognizant is the group's number four. At roughly $21 billion in 2025 it sits about level with Infosys, behind Tata Consultancy Services (~$31 billion) and far behind Accenture (~$70 billion), and ahead of HCLTech and Wipro. It is a large, established participant — but not the price-setter, and not the fastest.
A growth laggard with competitive margins
The competitive read splits cleanly in two. On profitability, Cognizant is unremarkable in the good sense: its 16.1% operating margin [3] sits mid-pack — comfortably above Accenture (15.6%), Wipro and Capgemini, roughly level with HCLTech, and below only the two India-heritage margin leaders, Tata Consultancy Services (~25%) and Infosys (~21%). Nothing here marks Cognizant as a structurally inferior operator.
Growth is the other half, and it explains the discount. Cognizant's revenue grew 7.0% in 2025 (6.4% in constant currency) [4], but that headline is flattered by the Belcan acquisition folded in from late 2024. The multi-year trend is the honest gauge: a three-year revenue CAGR of about 2.8%, the second-lowest in the group, ahead of only Wipro and Capgemini and trailing Infosys, Tata Consultancy Services and HCLTech by three to six points a year.
Source: derived from each company's reported financials — trailing three-year revenue CAGR and latest-fiscal-year operating margin; peer figures as reported in native currency, so margins compare cleanly, growth rates by percentage. Company filings, as reported.
The pattern matters because margin is a floor, not a differentiator: everyone in this group clears mid-teens operating margins on the same labor-arbitrage economics. What separates a re-rating from a value trap is the growth rate, and on that measure Cognizant is closer to the two European-style laggards than to the Indian compounders. The moat, on this evidence, is narrow: scale, client relationships and delivery breadth are real and hold margins in line, but they are not translating into pricing power or share gains against faster rivals. Execution parity is not an advantage.
The market pays for growth
That split — competitive margins, laggard growth — is exactly what the valuation reflects. On trailing earnings Cognizant trades near 9.5 times, the cheapest of the group bar Capgemini, while the faster India-heritage names command 15 to 20 times.
Source: trailing P/E computed as current market capitalization divided by latest-fiscal-year net income; market and financial data as of July 17, 2026. Company filings and market data, as reported.
The ladder is orderly: the multiple tracks the growth rate almost rank-for-rank. HCLTech and Infosys, growing 7–9%, earn premiums; Cognizant and Capgemini, growing under 3%, are priced as low-growth cash returners. On that reading, much of the discount to the Indian pure-plays is earned — a slower grower with equal margins should trade cheaper. The mispricing case, if there is one, is narrower and more specific: Cognizant is valued essentially in line with Capgemini, a firm growing at a third of a percent, when Cognizant still compounds low-single-digits with a net-cash balance sheet and steadier cash conversion (Cash Conversion). Its 9.5-times trailing figure is also flattered upward by the one-time OBBBA tax charge that depressed 2025 net income; normalized, the multiple is closer to eight — cheaper than the screen shows, not dearer.
The selloff was the sector's, not Cognizant's
The most important thing the peer group settles is a question left open at the report's start: how much of Cognizant's near-halving was company-specific. The answer is almost none of it. Between the end of 2025 and mid-July 2026, every name in the peer set fell between 26% and 48%. Accenture — the largest, highest-quality franchise in the group — fell the most, 48%, a shade more than Cognizant's 47%.
Source: daily closing prices, December 31, 2025 to July 17, 2026, each in its local listing currency (price move only, currency-neutral). Market data, as reported.
This reframes the derating that opened the report. It was not a verdict on Cognizant's execution — bookings grew and guidance held through it — but a repricing of the entire labor-arbitrage IT-services model on fear that generative AI severs the headcount-to-revenue link. That the market marked down Accenture, the sector's premium operator, even harder than Cognizant tells you the fear is structural and industry-wide, not a Cognizant-specific stumble. For a value investor, that cuts both ways: the discount is unlikely to be about hidden company rot, but the risk being priced is a real, shared one that no single firm's results can dispel.
Receivables drift is an industry feature
Cash Conversion flagged Cognizant's rising days-sales-outstanding as a working-capital drag on earnings quality and asked whether peers show the same. On a like-for-like basis — trade receivables against revenue — they do. Cognizant's roughly 77 receivable-days sits inside the large-offshore band, below Tata Consultancy Services (~93) and HCLTech (~88) and modestly above Infosys and Accenture.
Source: derived as trade receivables divided by revenue times 365, latest fiscal year; receivable definitions vary across filers, so read as directional. Company filings, as reported.
The elevated receivable days that come with fixed-price and outcome-based work are, then, a feature of the large India-heritage cohort rather than a Cognizant-specific red flag — Cognizant's own broader DSO measure, which adds contract assets, reads 81 to 84 days [5], still short of the group's high end. The definitional caveat is real (filers draw the receivable line differently), so this benchmarks levels loosely, not to the day. But it removes the working-capital drift from the list of things unique to Cognizant.
What would change the read
The competitive picture is coherent. Cognizant is a scaled, profitable, cash-generative participant whose margins and receivables sit squarely inside the peer band, but whose multi-year growth trails the faster India-heritage names by a wide enough margin to explain most of its cheaper multiple. The 2026 collapse was a sector-wide AI rerating, not a Cognizant-specific failure — Accenture fell harder. So the discount is real but largely rational; the specific margin-of-safety claim is that Cognizant is priced as a no-growth stub, like Capgemini, when its growth, balance sheet and cash quality are a notch better.
That read would strengthen if Cognizant's constant-currency growth converges toward the 6–9% band its faster peers post — the clearest catalyst for closing the multiple gap — or if the sector-wide AI fear proves overdone and the whole group re-rates together. It would weaken if organic growth (stripped of Belcan) drifts toward the sub-1% stagnation of Wipro and Capgemini, in which case the peer-low multiple is not a bargain but an accurate price for a business the industry is growing past. The distinction turns on the growth durability tested in The Nonlinearity Test, now with a competitive yardstick attached: convergence is the bull case, and Wipro is what the bear case looks like.
At about $44, Cognizant's roughly $19.5 billion enterprise value capitalizes its free cash flow at more than 12%. Discounted at a 10% cost of equity, that price embeds a perpetual decline of about 2% in free cash flow. Four independent methods put fair value near $60–68, over a no-growth floor of roughly $55. So a margin of safety exists — but it is moderate, not table-pounding, and it is most sensitive to whether the cash-flow base holds.
What $44 buys
What an owner actually buys at $44 is worth spelling out. Cognizant guides to about 473 million shares for 2026 [1], a roughly $20.8 billion equity value. Against that sits a net-cash balance sheet — $1,901 million of cash and $13 million of short-term investments versus $33 million of short-term and $543 million of long-term debt at year-end 2025 [2], or about $1.34 billion of net cash. Enterprise value is therefore near $19.5 billion.
The cash flow that value claims is substantial and steady. Cognizant generated $2,883 million of operating cash flow in 2025 against $288 million of capital spending [3] — about $2.6 billion of free cash flow, and a five-year average near $2.2 billion. Cash Conversion established that this converts net income at a durable ~1.1x once one-off tax items are removed, so the free-cash-flow base is real rather than an accrual artefact.
Share Price
Forward P/E
FCF Yield (mkt cap)
EV / Free Cash Flow
Analyst Mean Target
Share price and mean analyst target from market data, as reported (price July 17, 2026; consensus as of July 17, 2026). Forward P/E on 2026 adjusted-EPS guidance of $5.63–5.77 [4]; FCF yield and EV/FCF on normalized free cash flow of ~$2.4 billion derived from the FY2025 cash-flow statement [5].
At 7.7 times forward earnings and roughly eight times free cash flow, the multiple is undemanding on its face. The number is plainly low; what matters is the future it discounts.
The growth the market has priced out
A reverse discounted-cash-flow test answers that directly. Hold enterprise value at $19.5 billion, use a 10% cost of equity — reasonable for a business with no net debt, low capital intensity, and a globally diversified client base — and solve for the perpetual free-cash-flow growth rate the price implies. On normalized free cash flow of about $2.4 billion, that rate is roughly negative 2%. On 2025's actual $2.6 billion, it is more negative still.
Implied perpetual growth solving EV = FCF ÷ (r − g) at EV ≈ $19.5B and normalized FCF ≈ $2.4B; balance-sheet and cash-flow inputs from the FY2025 10-K [6].
Whichever discount rate one prefers, the market is not pricing stagnation — it is pricing a slow, permanent shrinkage of the free-cash-flow base. Cognizant's ~$19.5B enterprise value on ~$2.4B normalized free cash flow at a 10% cost of equity implies roughly -2% perpetual FCF growth against guided +4% to +6.5% constant-currency revenue, yet every one of its six named peers fell 26% to 48% over the same window (Accenture worst at -48% vs CTSH -47%) while Cognizant's own organic constant-currency growth cooled to ~2.9% on flat annual contract value — so the market is pricing an industry-wide, not company-specific, secular decline. That framing is worth dwelling on, because it is exactly the opposite of what the company and the sell-side expect. Management's own 2026 guidance is 4.0%–6.5% constant-currency revenue growth and 7%–9% adjusted-EPS growth [7]; consensus carries $5.69 in FY2026 earnings rising to $6.18 in FY2027, mid-single-digit revenue growth throughout. The gap between "grows a few percent" and "declines a few percent forever" is what the investment case turns on, and it is what The Nonlinearity Test was built to adjudicate: that chapter's read was that generative AI is bending the headcount-to-revenue link, not breaking it.
Triangulating fair value
No single model settles a valuation, so it is worth seeing where independent lenses land. Four of them cluster.
No-growth capitalization and DCF built on normalized FCF (~$2.4B) and net cash (~$1.34B) from the FY2025 10-K [8]; forward-earnings multiples on 2026 adjusted-EPS guidance [9]; mean target from market data, as reported.
The no-growth floor is the most important number for this reader. Capitalize $2.4 billion of free cash flow at a 10% required return and add net cash, and the business is worth about $55 a share assuming it never grows again. At $44 the stock trades roughly 20% below that floor — meaning the buyer is paid to hold a business the market assumes is in terminal decline, and gets any growth for free. The June 2026 low of $38.73, noted in Business and Derating, was about 30% below the no-growth value: for a few weeks the market priced not merely no growth but active erosion.
The other three lenses converge near $60–68. Notably, the sell-side mean target of $64 is not a heroic call — it implies roughly 11 times forward earnings and about 2% of embedded growth. The upside to that consensus is a re-rating story, not a growth story: the multiple need only normalize from eight times toward a still-cheap eleven for the stock to reach the mid-$60s. That is a lower bar than betting on accelerating revenue.
The margin of safety and its condition
For a value investor demanding a margin of safety, the arithmetic is favorable but not overwhelming. Against a triangulated fair value near $64, the ~$44 price offers roughly 45% upside; against the harsher no-growth floor of ~$55, about 25%. Two structural features harden the downside. First, the balance sheet: $1.34 billion of net cash is a real, if modest, cushion — about $2.80 a share — and it removes the bankruptcy risk this reader excludes outright, since a business with more cash than debt and $2.6 billion of annual free cash flow does not fail. Second, the mechanics of the buyback: with the board having doubled the 2026 repurchase target to $2 billion and left about $3.45 billion authorized [10], a fixed-dollar program retires far more stock at $44 than at $75, quietly compounding per-share value for a non-seller — the argument Capital Allocation developed in full.
But the margin of safety depends above all on the free-cash-flow base not eroding. Every fair-value estimate above starts from ~$2.4 billion of durable free cash flow. If generative AI genuinely compresses labor-arbitrage economics — if the ~50% fixed-bid book reprices, or pricing-per-person deflates — then the "no-growth floor" is not a floor at all, and the market's implied −2% could prove generous rather than fearful. That is the honest counter-case, and it is not idle: Standing Among Peers showed the entire sector re-rated 26%–48% in 2026, so the market is discounting a real, industry-wide risk, not a company-specific panic. The valuation does not resolve that debate; it prices it. What the low multiple does is change the odds — at eight times free cash flow, the model has to actually shrink, not merely stop growing, before a buyer at $44 loses money.
That is the shape of the setup this reader looks for: near-term pain already inflicted, a cheap price, a clean balance sheet, and a clear condition — free-cash-flow durability — whose resolution over the next few prints decides whether the ~$55 floor holds or gives way.
What would change the read
Two observations would firm up the case: organic revenue (ex-Belcan and the cloud acquisitions) holding at or above the low-single digits, and realized margins on the fixed-bid book tracking plan through 2026 — the falsification test flagged in The Nonlinearity Test. Two would break it: a sequential decline in free cash flow that is not explained by working-capital timing, or evidence that pricing per delivered outcome is deflating as AI tooling spreads. The valuation is cheap enough to be interesting and cushioned enough to be safe-ish; whether it is cheap enough to be a margin of safety depends on which of those the next few quarters show.
Capital Allocation
What management does with Cognizant's cash is the bridge between a cheap cash generator and the value that reaches a shareholder. Over 2021–2025 the company returned about $8.1 billion — roughly three-quarters of its free cash flow — split between buybacks and a growing dividend, all on a net-cash balance sheet. The development that matters now is how it is deploying that policy into the derating. Cognizant doubled its 2026 buyback to $2 billion with the stock in the low $40s, ~20% below a ~$55 no-growth free-cash-flow floor, so at ~$44 the program retires about 9.5% of shares a year versus 5.5% at the $75.40 it paid a year earlier — but directors and officers as a group hold only ~0.43% of the stock (~0.13% vested), with a single ~$210k open-market purchase across ~398 Form 4 transactions.
Both halves belong in the same breath. The accretion is real only if $44 is genuinely below intrinsic value: Margin of Safety puts the no-growth floor near $55, so the same $2 billion the board added to the 2026 program [1] retires roughly 9.5% of the shares — compounding per-share value for a non-seller, but amplifying the durability bet rather than hedging it. In the bear case, where the true no-growth value sits below $44, the same program destroys per-share value by overpaying with the company's own cash. The insider record is the counter-fact a fallen-star screen tests directly: a management group that owns only ~0.43% of the stock [2], with a single ~$210,000 open-market purchase across roughly 398 Form 4 transactions (Ownership and Governance develops the ownership record), is not the conviction signal that usually accompanies a mispriced-cheap thesis. On the reader's fallen-star-with-strong-insider-ownership screen, this leg fails.
Nearly all the cash goes back out
Cognizant runs to a stated capital-allocation framework: deploy roughly 100% of free cash flow each year, targeting about 50% for acquisitions, 25% for share repurchases and 25% for dividends [3]. That split has been the policy for years — the same 50/25/25 language appears in the 2021 10-K [4], Capital Allocation Framework — p.60").
In practice, the shareholder-return half of that policy is steady and large. Over 2021–2025 Cognizant paid out $5.24 billion in buybacks and $2.87 billion in dividends — $8.1 billion returned, against $10.9 billion of free cash flow generated over the same five years, or about three-quarters of it. The rest went to acquisitions, and the balance sheet still ended in a net-cash position. This is a company that neither hoards cash nor stretches for it.
Source: derived from FY2021–FY2025 10-Ks, Consolidated Statements of Cash Flows [5], Consolidated Statements of Cash Flows — p.90"). Free cash flow = operating cash flow less capital expenditure.
Returned 2021–2025 ($M)
Share of 5-yr Free Cash Flow
Net Cash, YE2025 ($M)
Diluted Shares Cut, 2021–2025
Source: derived from FY2021–FY2025 10-Ks, cash-flow statements, balance sheet and share counts [6], Consolidated Statements of Cash Flows — p.90").
The dividend is the quieter half. Cognizant only initiated a dividend in 2017 — late for a company of its age — and has raised it every year since, paying $1.24 per share in 2025 and lifting the quarterly rate to $0.33 in February 2026 [7]. At around $44 that is close to a 3% yield, but it is the smaller lever; the buyback and M&A move the needle.
The framework flexes — 2024 was the acquisition year
The 50/25/25 split is a target, not a rule, and the "50% for acquisitions" slice is the one that swings hardest. Most years buybacks dominate; in 2024 the mix inverted. Cognizant cut repurchases to $605 million — less than half its usual pace — and spent the room on deals: Thirdera, a ServiceNow partner, for $428 million in January, and Belcan, an aerospace and defense engineering-services firm, for $1.36 billion in August ($1.20 billion cash plus 1.47 million shares) [8]. On the company's own accounting, 2024 ran 57% to acquisitions and only 22% to buybacks [9]. The pattern continued into 2026 with 3Cloud, a Microsoft Azure and AI-services firm, for $733 million [10].
The acquisitions are where a skeptic's attention is best spent. A decade of deals has lifted goodwill from about $2.6 billion in 2016 to $7.1 billion at the end of 2025 — now roughly 47% of shareholders' equity [11]. None of it has been impaired, which is a point in management's favor, but the deals' contribution is hard to separate from the core. Belcan is the clearest case: it anchored the 2024 acquisitions that added $384 million of revenue in their first partial year and lifted 2025's reported growth to 7% [12] — the same reported figure that, as Standing Among Peers showed, still left Cognizant with the second-lowest multi-year growth in its peer group once the acquisitions are stripped out. The acquisitions buy growth and adjacency; whether they compound value per share above their cost is, so far, unproven.
Source: derived from FY2021–FY2025 10-Ks, Consolidated Statements of Cash Flows [13], Consolidated Statements of Cash Flows — p.90"). The 2024 dip funded the Thirdera and Belcan acquisitions.
The buyback has been mechanical, not shrewd
The buyback is real money — but its timing has been price-insensitive rather than opportunistic, and that matters to a value investor for whom the case is most sensitive to buying cheap. The clearest evidence is the fourth quarter of 2025, when Cognizant repurchased $325 million of stock at an average of $75.40 a share, buying more as the price climbed — 0.7 million shares in October at $67.58, then 2.1 million in November at $72.81, then 1.5 million in December at $82.90 [14], Cash Dividends and Issuer Purchases — p.48"). Within roughly six months the stock had fallen into the low $40s. Management was not buying its stock because it was cheap; it was buying on a schedule, and the schedule ran straight into a top.
That price-insensitivity also explains why five years and $5.24 billion of repurchases shrank the diluted share count only about 7% — from 528 million in 2021 to 489 million in 2025, under 2% a year. Buying at $70–90 for most of the period, with stock-based pay and deal shares leaning the other way, blunted the per-dollar effect. Steady, yes; shrewd, no.
The derating changes the arithmetic
Here the story turns. In May 2026 — with the stock already halved — the board added $2 billion to the repurchase authorization and, more tellingly, raised the amount it expects to repurchase in 2026 from $1 billion to $2 billion, leaving about $3.45 billion authorized [15]. First-quarter 2026 repurchases had already stepped up to $444 million, more than double the $209 million of a year earlier. The same buyback that bought high in 2025 is now being pointed, at scale, at a much lower price.
The arithmetic of a fixed-dollar buyback is unforgiving in the company's favor here. The identical $2 billion retires far more stock at $44 than at the $75.40 it paid a year earlier:
Source: derived from the 2026 repurchase target [16] and Q4 2025 average repurchase price [17], Cash Dividends and Issuer Purchases — p.48"); shares out ~479M.
At $44, a $2 billion program retires roughly 9.5% of the shares outstanding in a single year — nearly double the 5.5% the same spend would have bought at last year's prices. For a holder who is not selling, the derating and a maintained buyback compound in their favor: the cheaper the stock stays, the more each dollar of the company's own cash buys back. The honest caveat is that this only helps if the shares are genuinely cheap rather than cheap for a reason — the durability questions the earlier chapters raised — and that management's demonstrated willingness to buy at any price cuts both ways.
The balance sheet removes the tail risk
For a reader who will not own anything that could go bankrupt, the financing side closes cleanly. At the end of 2025 Cognizant held $1.9 billion of cash and short-term investments against just $576 million of total debt — $33 million short-term and $543 million long-term — a net-cash position of roughly $1.3 billion [18][19]. The capital-return program is funded entirely by operating cash, not leverage, and an untapped revolving facility sits behind it. Whatever the outcome of the AI-durability debate, solvency is not part of it.
What would change the read
The capital-allocation case is a qualified positive: the cash comes back, the balance sheet is unlevered, and the derating has quietly turned a mediocre buyback into a materially more accretive one. Three things would sharpen — or spoil — that read. First, whether management actually executes the raised $2 billion at these prices, rather than tapering when the stock recovers; the 2024 pivot shows the framework bends toward deals when management prefers them. Second, whether the 3Cloud and Belcan acquisitions earn their $7.1 billion of goodwill, or whether a future impairment reveals the M&A slice as growth bought too dearly. Third, whether the buyback's per-share bite finally widens now that the price is low — a share count that keeps shrinking only ~2% a year, even at $44, would signal the cash is leaking to dilution and deals faster than it returns to owners.
Ownership and Governance
Cognizant is owned by institutions, not insiders. Directors and officers as a group hold about four-tenths of one percent of the stock; there is no founder and no controlling holder, and the largest owners are index funds. That absence of insider skin in the game is a genuine gap for anyone hunting a fallen stock where management's own money rides alongside theirs. But the governance itself is clean — an independent board, a single share class, no takeover armour, no related-party dealings — so the gap is a missing positive, not a red flag.
Who owns Cognizant
The register looks like what it is: a large, widely held US technology company two decades past its founding. As of April 2026 the three biggest holders were all passive index managers — BlackRock at 9.0% and State Street at 5.3% of the roughly 471 million shares outstanding [1], with Vanguard's various entities together near 13% after an internal realignment the proxy notes disaggregated their reporting [2]. Invesco crossed the 5% line in a July 2026 filing. None of these is a strategic owner; they hold Cognizant because it sits in the indices, and they will vote it the same way.
Against that float, the people running the company own almost nothing outright. The proxy states plainly that each director and named officer owns less than 1% of the shares, and that the current directors and executive officers as a group own less than 1% [3]. The group's total stock-based holdings — 20 people, everything counted, including unvested awards and deferred units — come to 2,026,731 shares, about 0.43% of the company [4]. Strip out the unvested and deferred paper and the vested, freely-owned common held by the entire insider group is roughly 605,000 shares — about 0.13% of the outstanding stock.
Source: 2026 Proxy Statement, Share Ownership table — BlackRock and State Street 5%-holder disclosure and the directors-and-officers group total [5]. Vanguard's ~13% aggregate is from its Schedule 13G filings; the proxy notes Vanguard's March 2026 reporting realignment.
Insiders own (group)
That single number answers the first thing a value investor checks on a beaten-down stock: whether management owns what he would be buying. Here, in an ownership sense, it does not. The alignment that exists runs through compensation and oversight, not through a personal stake — which is the rest of this chapter.
The alignment the screen wants is not on the register
Cognizant has no founder in its ownership or its management, and it has changed chief executives twice in four years. Ravi Kumar S has been CEO since January 2023, succeeding Brian Humphries; neither built the company [6]. The board has also been substantially refreshed — five new independent directors since 2022, and one who joined in 2023 resigned in January 2024 [7]. This is a professionally managed institution, not a founder's vehicle; the continuity a founder-led business offers — and the conviction signal of a founder's own capital at risk — is simply not part of the case.
What Cognizant substitutes is pay-for-performance equity, and its design is more aligning than the raw numbers first suggest. CEO Ravi Kumar's 2025 total compensation was $21.5 million, of which only $1.3 million was salary; the bulk was $15.8 million of stock awards plus a $4.4 million cash incentive, with no stock options granted [8]. His largest holding by far is 647,130 unvested performance and restricted units — roughly five times his vested stake [9]. So while management owns little outright, its paper wealth is heavily levered to the share price the market has just halved. That is a real, if second-best, form of alignment: the people setting strategy feel the derating in their own unvested balances, even if they did not put personal cash on the line to build the stake.
The CEO pay ratio of 477:1 against the worldwide median employee looks jarring until it is decomposed. That ratio is an artefact of Cognizant's delivery model, not of runaway pay. The worldwide median employee earned $45,138, because 256,900 of the company's 351,600 people work in India; measured against the US median employee ($140,739) the ratio falls to 153 to 1 [10]. The headline number says more about labour arbitrage than about governance.
Governance clears the red-flag bar
Whatever it lacks in insider ownership, Cognizant carries none of the structural warning signs that would put a governance-sensitive investor off before the numbers are even reached. The board is 12 independent directors out of 13 nominees — every member except the CEO is independent, every committee is entirely independent, and directors face annual election under a majority-vote standard [11]. The Chair and CEO roles have been separate since 2003, with an independent Chair since January 2023 [12].
Just as important for a minority holder is what Cognizant does not have. There is one class of common stock — one share, one vote, no founder super-vote — no poison pill or rights plan, proxy access for long-term holders, and a right for 10% holders to call a special meeting [13]. Related-party dealings — the classic tunnel through which insiders extract value — are absent: the company reports no transactions requiring disclosure with any related person since January 1, 2025 [14]. The only blemish in the filing record is a single Form 4 filed one business day late in 2025, an administrative slip, not a pattern [15].
Source: the proxy's Governance Highlights section, on committee independence and the cash-severance policy [16] and its Related Person Transactions and Section 16(a) disclosures [17].
The one contested governance item on the 2026 ballot underlines the point: the sole shareholder proposal is a serial-filer's request for the right to act by written consent, which the board recommends against [18]. It is a procedural skirmish, not evidence of a governance problem. On the reader's own exclusion — never touch a company whose governance looks weak — Cognizant passes without difficulty. The India secondary-listing idea that has circulated in the market does not appear anywhere in the company's filings, and should not be treated as a live plan.
What insiders actually did into the crash
Those two facts — a negligible insider stake and the most aggressive buyback in the company's history — meet in a single line. Cognizant doubled its 2026 buyback to $2 billion with the stock in the low $40s, ~20% below a ~$55 no-growth free-cash-flow floor, so at ~$44 the program retires about 9.5% of shares a year versus 5.5% at the $75.40 it paid a year earlier — but directors and officers as a group hold only ~0.43% of the stock (~0.13% vested), with a single ~$210k open-market purchase across ~398 Form 4 transactions.
If outright ownership is thin, insider behaviour through the 2026 derating is the more revealing data point — and it is muted rather than reassuring. Across roughly 400 recorded insider transactions, only one is an open-market purchase: independent Chair Stephen Rohleder bought 4,034 shares at about $52 on June 10, 2026 — a ~$210,000 vote of confidence as the stock sat near its lows. Every other acquisition in the record is a routine grant or option exercise, and the modest 2026 selling — around $1.2 million, spread across three officers — ran through pre-set 10b5-1 plans rather than discretionary decisions to lighten up.
That is a mixed signal, and worth stating plainly. A single director's six-figure purchase into a halved stock is a small positive, but it is not the wave of insider buying that usually accompanies genuine conviction that the stock is mispriced. Set against a management team whose vested holdings are tiny, the honest read is that insiders are neither dumping nor backing up the truck — they are watching their unvested equity re-price along with everyone else's.
Source: SEC EDGAR Form 4 filings for Cognizant insiders (398 transactions through July 2026); one open-market purchase (Rohleder, June 10, 2026) versus routine grant, vesting and 10b5-1 activity. No source PDF exists for Form 4 data in this corpus, so no page link is available.
What it adds up to
For an investor who wants a fallen star where insiders own a large slug and a founder is buying, Cognizant delivers the fall but not that ownership. The register is institutional, the insider stake is negligible, and the alignment runs through performance equity and independent oversight rather than personal capital at risk. What tips the balance from "avoid" to "acceptable" is the quality of the governance itself: a genuinely independent board, one share class, no entrenchment devices, and a clean related-party record clear the red-flag bar that would otherwise end the discussion.
The read would change in either direction on evidence the corpus cannot yet give. A broad flush of open-market insider buying — several officers, not one director — would convert the alignment gap into a conviction signal. Conversely, a slide in governance quality — a controlling stake emerging, related-party deals appearing, or the board turning defensive — would move Cognizant from "missing a positive" to "carrying a negative," and for this reader that is the line between a candidate and a pass.
Cognizant re-accelerated from a flat 2023 to +6.9% revenue growth in 2025, its best year since 2016, and enters 2026 with a fuller order book — first-quarter bookings up 21% and a 1.4x book-to-bill [1]. But the coincident line is softening: organic constant-currency growth slipped to roughly 2.9% in Q1 2026, annual contract value went flat, and management now leans on a second-half discretionary recovery it cannot yet see [2]. The leading indicators point up; the near-term ones point down.
The 2025 reacceleration was real — and roughly a third bought
The starting point matters. Revenue was essentially flat in 2023 (‑0.4%) and grew only ~2% in 2024 before jumping 6.9% to $21.1 billion in 2025 [3][4]. That is a genuine inflection: four straight quarters of adjusted-margin expansion, +11% adjusted EPS, and management declaring it had reached its self-set "winner's circle" of large-cap growth two years early [5].
Reported (as-stated) revenue growth. 2022 +5.0% and 2023 −0.4% per the FY2022/FY2024 10-Ks; 2024 +2.0% and 2025 +6.9% per the FY2024/FY2025 10-K MD&A [6][7][8].
The reacceleration was partly purchased. Of the 6.4% constant-currency growth in 2025, about 260 basis points came from the Belcan acquisition, leaving organic constant-currency growth of roughly 3.8% [9]. Through the first half of 2025 the headline looked far stronger — +8.2% constant currency in Q1 and +7.2% in Q2 — but each of those quarters carried ~400 basis points of inorganic Belcan contribution [10][11]. Stripping the acquisition out, the underlying pace was steadier — around 3–4% — not the accelerating curve the reported numbers implied.
The deceleration hides under a lapping acquisition
Because Belcan closed in August 2024, its contribution fades out of the year-over-year math from Q3 2025. That mechanical lapping makes the total constant-currency line look like a collapse — from 8.2% to 3.8% in four quarters — when most of the drop is simply the acquisition anniversarying out. The signal worth watching is the organic line underneath it.
Total constant-currency growth as reported each quarter; organic derived by removing management-stated inorganic contribution (~400bps Q1–Q2, <250bps Q3, nil Q4 all-organic, ~100bps Q1'26 from 3Cloud). Q1'25 organic "4%" and Q4'25 "all organic" are management figures; Q2/Q3/Q1'26 organic are approximate [12][13][14][15][16][17].
Organically, the story is a modest cooling rather than a break. Growth held near 4% through most of 2025 — Q3 marked all four segments growing organically, the strongest sequential organic growth since 2022 [18] — then eased to roughly 2.9% in Q1 2026 (3.9% constant currency less ~100 basis points from the 3Cloud deal) [19]. Management named the cause directly: a "softening demand environment" that has grown "more complex since the start of the year," with the impact of macro uncertainty expected to persist near term [20]. The softness is not new — the company flagged a sharp change in the environment as early as April 2025, when clients in Health Sciences and Products & Resources slowed decision-making [21].
Q1 2026: a strong order book over a soft demand base
The most recent print is a study in mixed signals.
The order book is filling. Q1 2026 bookings grew 21% year-over-year — the strongest in recent history — with 7 large deals of $100 million-plus total contract value, including one mega-deal above $500 million; the trailing-twelve-month book-to-bill rose to 1.4x [22][23]. That extends a pattern: bookings are lumpy quarter to quarter — up 18% in Q2 2025, then down 5% in Q3 — but the trailing trend turned up, from ~5% through 2025 to 11% on a trailing basis in Q1 2026 [24][25][26].
But the quality of that book has shifted. Annual contract value was flat in Q1 2026 even as total contract value surged, because deal duration lengthened — the growth is concentrated in long-dated, cost-takeout and vendor-consolidation megadeals, while "smaller discretionary projects" stayed soft [27]. A fatter book of longer, cheaper-per-year cost-savings work converts to revenue more slowly and at tighter margins than a book of discretionary transformation spend. That is visible already: Q1 gross margin fell 80 basis points year-over-year, and adjusted operating margin expanded only 10 basis points [28].
Segment optics are being distorted by a low-margin pass-through. Cognizant's "integrated offering" strategy resells third-party software products alongside its services, and the swings are large enough to mislead. In Q1 2026 that resale added roughly 10 percentage points of growth to the Communications, Media & Technology segment while subtracting about 300 basis points from Health Sciences; excluding it, Health Sciences services grew in line with the company [29]. The genuine bright spot is Financial Services, up more than 10% in constant currency on healthy discretionary spending across banking and insurance — a real signal, not an accounting one [30].
The guidance architecture: margin raised, revenue held, recovery assumed
How management built the 2026 outlook shows where the risk sits.
FY2026 guidance as issued 4 Feb 2026 and revised 29 Apr 2026. Feb figures from the Q4 2025 guidance supplement; April revisions from the Q1 2026 call [31][32].
Three things stand out. First, the revenue range implies organic constant-currency growth of only about 3.8% at the midpoint — roughly the 2025 organic pace, not an acceleration — with about 150 basis points of the reported growth coming from acquisitions, a third of which is M&A not yet done [33]. Second, the midpoint now assumes a second-half improvement in discretionary spending — a recovery that has not yet appeared in the coincident data [34]. Third, management held revenue but raised adjusted margin and EPS — and the fuel is cost, not volume. The Project LEAP program is guided to deliver $200–300 million of 2026 savings, at a one-time charge of $230–320 million (mostly severance) that is adjusted out of the non-GAAP numbers investors are being asked to value on [35]. Free-cash-flow conversion guidance of 90–100% of net income was unchanged, so the cash engine that anchors the Margin of Safety case is not, on management's own numbers, cracking yet [36].
The read, and what would change it
On the evidence, this is deceleration inside a durable business, not the start of secular decline. Organic growth has cooled from ~4% to ~3%, but it is positive; the book-to-bill at 1.4x and 21% bookings growth say the pipeline is converting; and cash conversion guidance is intact. The honest counter-fact is that the composition has degraded exactly where a skeptic would look: the incremental book is long-dated cost-takeout work with flat ACV and thinner gross margin, the reported EPS beat is manufactured by an adjusted-out restructuring charge, and the full-year revenue midpoint rests on a discretionary recovery management concedes it cannot yet see. The bull and bear can each read this print as confirmation — which is precisely why the next few quarters, not this one, will show which reading holds.
Three observables resolve the direction:
- Organic constant-currency growth. Holding ~3% or reaccelerating toward 4% keeps the FCF base intact; a slide toward 1–2% is the early tell that the model is de-rating on fundamentals, not just multiple.
- Annual contract value, not just TCV. ACV turning positive would signal discretionary demand returning and the book converting to near-term revenue; a second and third flat-ACV quarter says the growth is increasingly deferred, low-margin cost work.
- Margin ex-LEAP and the second-half revenue shape. If the promised H2 discretionary recovery shows up, guidance is conservative; if it does not and margins hold only because LEAP severance keeps being adjusted out, the quality of the beat is the story.
This report has built the pieces — the business, the AI-nonlinearity test, cash conversion, the peer set, capital allocation, governance, valuation, and the order book. This closing chapter weighs them against each other. The case is most sensitive to one variable: whether the roughly $2.4 billion free-cash-flow base is durable — and at about $44 the market has already priced the answer as no. Cognizant's ~$19.5B enterprise value on ~$2.4B normalized free cash flow at a 10% cost of equity implies roughly -2% perpetual FCF growth against guided +4% to +6.5% constant-currency revenue, yet every one of its six named peers fell 26% to 48% over the same window (Accenture worst at -48% vs CTSH -47%) while Cognizant's own organic constant-currency growth cooled to ~2.9% on flat annual contract value — so the market is pricing an industry-wide, not company-specific, secular decline. What follows is not a call but a map: three paths, what each is worth, and the handful of dated signposts that will show which one is unfolding.
Does the free-cash-flow base last?
The arithmetic underneath is straightforward: Cognizant is a net-cash, low-capital-intensity business that turned $2,230 million of 2025 net income into $2,883 million of operating cash flow and, after $288 million of capital spending, roughly $2.6 billion of free cash flow [1]. Against a $19.5 billion enterprise value — $1.34 billion of net cash sits inside the balance sheet [2] — that cash flow capitalizes at more than 12%. Margin of Safety showed the arithmetic: at $44 the price embeds a perpetual 2% decline in that free-cash-flow stream, while a no-growth capitalization values the shares near $55 and a modest-normalization cluster sits at $60–68.
That ~$55 floor holds only if the ~$2.4 billion base is durable. Capitalize a base 15–20% lower and the no-growth value falls into the high-$30s to low-$40s — near the $38.38 the shares reached on June 30, 2026, roughly 30% below the floor — and the margin of safety is gone. The market has already priced beneath the floor once, when it feared the base itself, so the implied -2% reads as "too pessimistic" only on the condition that the cash flow proves durable, which is exactly what the corpus cannot yet settle.
That durability question is what the derating encodes. The 2026 derating was sector-wide, not company-specific — Standing Among Peers found every named competitor down 26% to 48% — which means the market is discounting an industry risk: that generative AI breaks the headcount-to-revenue link that funds this cash flow. The Nonlinearity Test judged that link bending, not yet breaking; revenue per employee rose about 7%, and the fixed-bid book is near half of revenue. Whether that holds through a full technology transition is the one thing the corpus cannot settle, because it has not happened yet. Everything below is a way of pricing that one uncertainty rather than pretending to resolve it.
Price (Jul 17 2026)
June 2026 Low
No-Growth FCF Floor
Consensus Mean Target
Price and June low from market data, as reported (2026 intraday low was $38.38 on June 30, 2026); no-growth floor derived from FY2025 free cash flow [3]; consensus mean target from the analyst-estimate feed, as reported.
Three paths for the cash-flow base
The scenarios below are not price forecasts; they are the three ways the durability question can resolve, each carried through to what the shares would be worth. The spread is wide — roughly $38 to the low-$70s — precisely because the input is binary in kind (does the model deflate?) even if gradual in time.
Scenarios derived from FY2026 guidance [4], Q1 2026 operating detail [5], and the FY2025 free-cash-flow base [6]; values per the Margin of Safety triangulation.
The reconciliation that matters is where the current price sits against this ladder. At $44 the market is not paying for the base case — it is paying below the no-growth floor of about $55, which itself assumes zero future growth. In other words, today's buyer is priced into the bear path (perpetual FCF decline) and receives the base and bull outcomes for nothing if they arrive. That is the shape of the margin of safety this report has described: real, moderate, and entirely conditional on the bear not being right about durability. The guidance in hand argues against the bear — management held constant-currency revenue at 4.0%–6.5% and raised adjusted EPS to $5.63–5.77 [7] — but the The Order Book caveat stands: that EPS raise came from Project LEAP cost cuts, not volume, and its $230–320 million severance charge is adjusted out of the very non-GAAP number being raised [8].
Where the two sides actually disagree
The bull and bear do not dispute the facts; they dispute what the same facts mean. Each row below is a shared, cited number — not a mood — and the evidence that would settle it.
| Shared fact | Bull reads it as | Bear reads it as | What decides it |
|---|---|---|---|
| Organic CC growth ~2.9% in Q1'26, down from ~3.8% [9] | A cyclical soft patch; management flagged macro caution, not lost work | The leading edge of structural AI deflation of labor-arbitrage revenue | Two to three more quarters of the organic trend |
| Bookings +21%, book-to-bill 1.4x, but ACV flat [10] | A fatter, stickier, longer-dated backlog that will convert | Down-priced cost-takeout and vendor-consolidation work that defers revenue and lowers margin | ACV turning positive; the mega-deals converting to reported growth |
| EPS raised via LEAP cost cuts, not volume [11] | Proactive margin management; a fifth straight quarter of expansion | Growth so weak it must be bought with severance excluded from non-GAAP | Whether margin holds without fresh adjust-outs; the NextGen base rate |
| Buyback doubled to $2B at ~$44 [12] | Accretive capital deployed below the no-growth floor | A price-insensitive program that also bought heavily near $75 in Q4'25 | Whether $44 is truly below intrinsic value — i.e., FCF durability again |
| Net cash $1.34B, FCF ~$2.6B, no net debt [13] | Downside is a de-rating, never insolvency | Optionality, not protection, if the earning power itself erodes | Not in dispute — this clears the bankruptcy exclusion either way |
Four of the five rows resolve to the same test: free-cash-flow durability. The disagreement is not really five arguments but one, seen from five angles. That is why no amount of further reading settles it — the evidence that decides it has not been reported yet. Which makes the signposts, not the scenarios, the operative part of this chapter.
What to watch, and the threshold that flips it
Each item below is falsifiable: a named line, the filing it appears in, and the number that would move the read from one path to another. The reader who tracks these four can watch the company resolve the durability question in real time, quarter by quarter.
Signposts derived from Q1 2026 disclosures: organic growth and ACV [14], Project LEAP and the India listing evaluation [15], and 2026 margin guidance [16].
Two of these deserve emphasis. The NextGen base rate is the cleanest way to judge the LEAP-funded EPS raise without waiting a year: management delivered 50 basis points of margin expansion in 2025 [17], so if the prior cost program actually reached the P&L, crediting LEAP's $200–300 million is reasonable; if it did not, the raise is a promise, not a result. And the India primary offering and secondary listing, which management confirmed it is actively evaluating [18], is the one catalyst on this list orthogonal to the durability debate — a discrete event that could re-rate the shares regardless of where organic growth settles.
How this sits for a margin-of-safety buyer
For an investor who hunts fallen stars with a large margin of safety and specifically likes setups that look bad for six to twelve months and then improve, Cognizant fits the shape of the thesis with unusual precision. The near-term is genuinely soft — management expects heightened macro uncertainty "to persist in the near term" [19], organic growth is decelerating, and the improvement is deferred into an unproven second-half recovery — while the order book fills for later. And the price sits ~20% below even the no-growth floor, so the margin of safety is present, not aspirational.
Two honest qualifications keep this from being a clean fit. First, the "later gain" is not independent of the bear case: this is a bad-now-better-later setup only if the softness is cyclical, and the whole report has been unable to rule out that it is structural. Second, this reader's screen also asks for strong insider ownership, and Ownership and Governance found insiders hold under 0.5% — the alignment here runs through equity compensation and clean governance, not through a founder's own capital at risk. The setup, then, is a fallen star with a real but conditional margin of safety and clean governance, whose near-term-pain/later-gain profile is exactly the reader's preference — carrying one unresolved risk that the pain is permanent. The signposts above are how that risk gets resolved, one quarter at a time.